


Ongoing budget deficits linger amid the post-COVID economic recovery. While markets appear unconcerned now, the accumulation of debt may exhaust investor patience. Anxiety about the sustainability of the nation’s debt could escalate with the upcoming elections in November. In part one of our series, let’s look at fiscal policy and Treasury debt.
Debt near record highs and still growing
US government debt stands at $34 trillion and counting. Federal debt (excluding government holdings) now equals 97% of GDP, up from 79% pre-pandemic and nearly triple the 35% level in 2007. This is the highest ratio since World War II—a threshold the Congressional Budget Office (CBO) projects could be crossed in the next five years.
US government debt is rising, both in dollars and as a percent of GDP
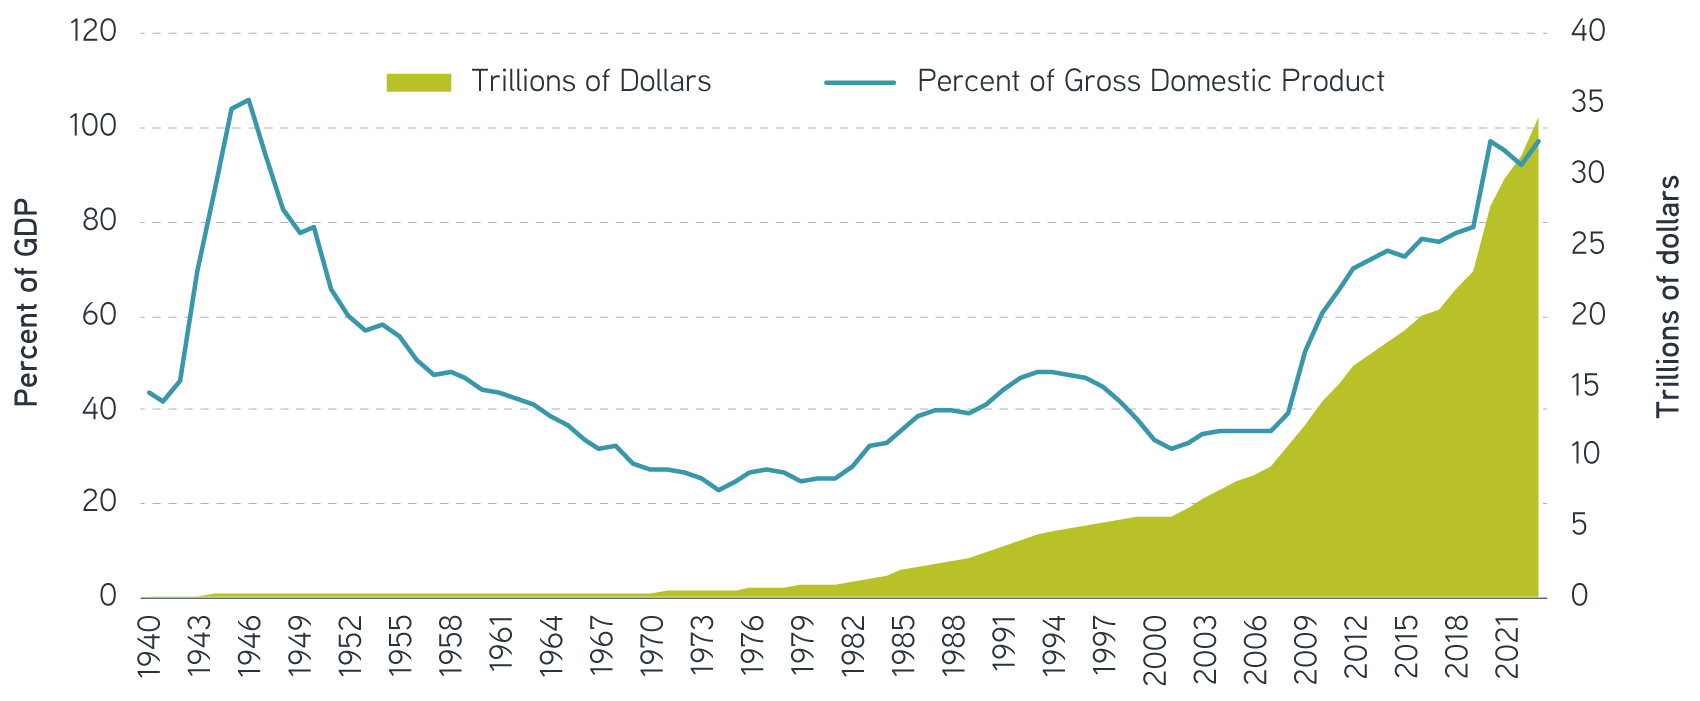
Source: Congressional Budget Office, Bloomberg.
Low interest rates in the 2010s facilitated the growth in debt. Prominent academics argued for greater fiscal spending then as the remedy to offset the forces of secular stagnation, which were limiting economic growth. As long as the average interest rate is less than the nominal growth rate, the existing stock of debt declines as a percentage of GDP. Lower rates made debt service costs on this growing balance seem manageable.
Today, higher rates challenge that narrative about debt sustainability. Annual interest on the nation’s debt has more than doubled over the past three years, with the potential to crowd out other forms of government spending. In one striking example, the CBO estimates that interest expense will exceed annual defense spending of $860 billion in 2024.
US government is spending more on net interest than defense in 2024
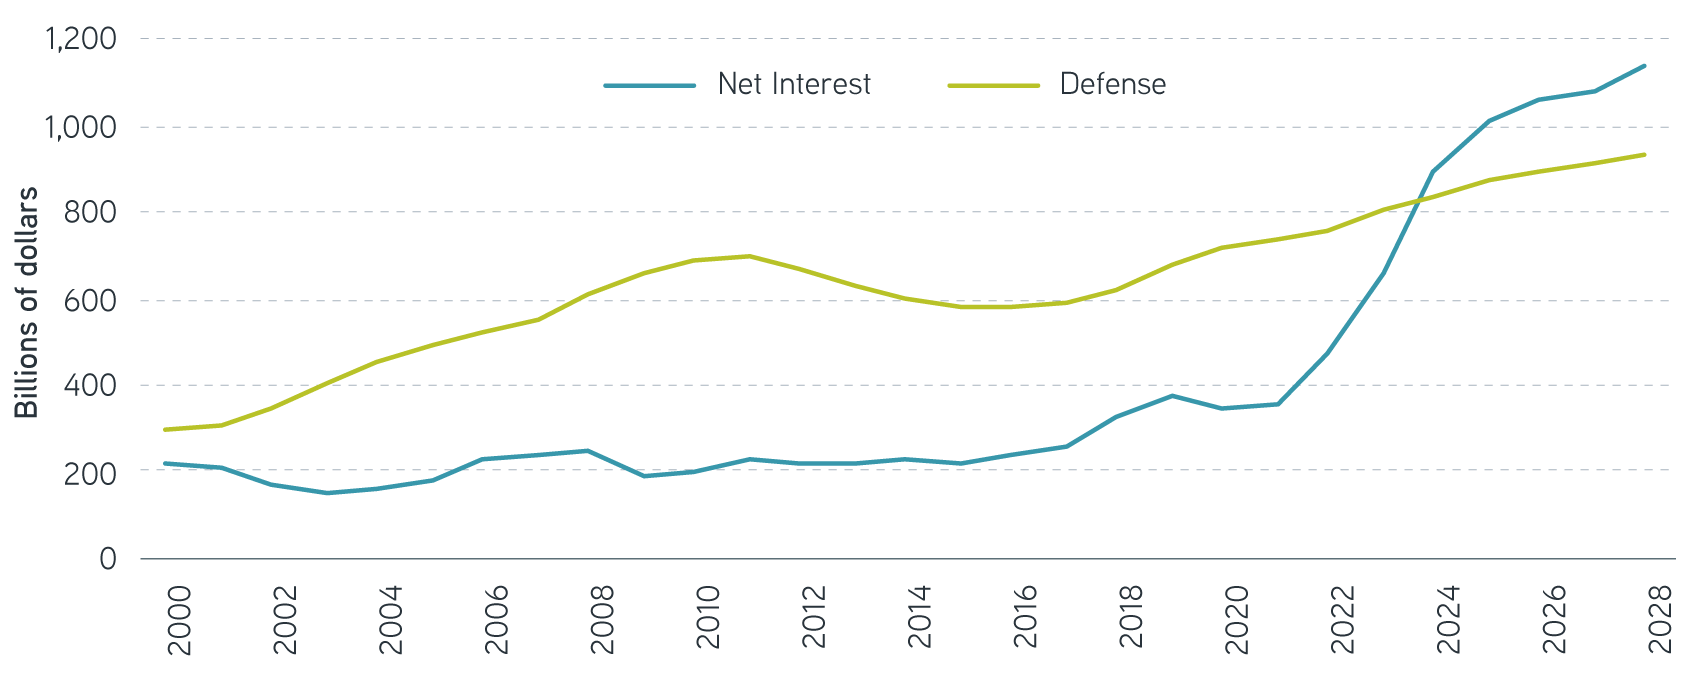
Source: Congressional Budget Office data as of June 18, 2024.
In the classic textbook illustration, deficit spending provides a countercyclical stabilizer to economic growth. Transfer payments increase during recessions, and government stimulus during COVID supported economic growth. But in 2023 the budget deficit exceeded 6% of GDP—despite economic growth above trend and an unemployment rate below 4%. Recent trends suggest the US may be at risk of structurally higher budget deficits.
Economic growth can help. In the current fiscal year, the CBO estimates that the primary deficit, before interest costs, could narrow as economic and market gains lead to over $400 billion in additional revenue. Unfortunately, interest expense could increase by over $200 billion, leaving the projected 2024 deficit again over 6%. Looking over the next decade, the CBO expects budget deficits to average 6.3% annually, compared with 3% annually in the 50 years pre-pandemic. And that assumes the provisions in the Tax Cut and Jobs Act (TCJA) will expire in 2025.
CBO projects a 6.3% average budget deficit over next decade
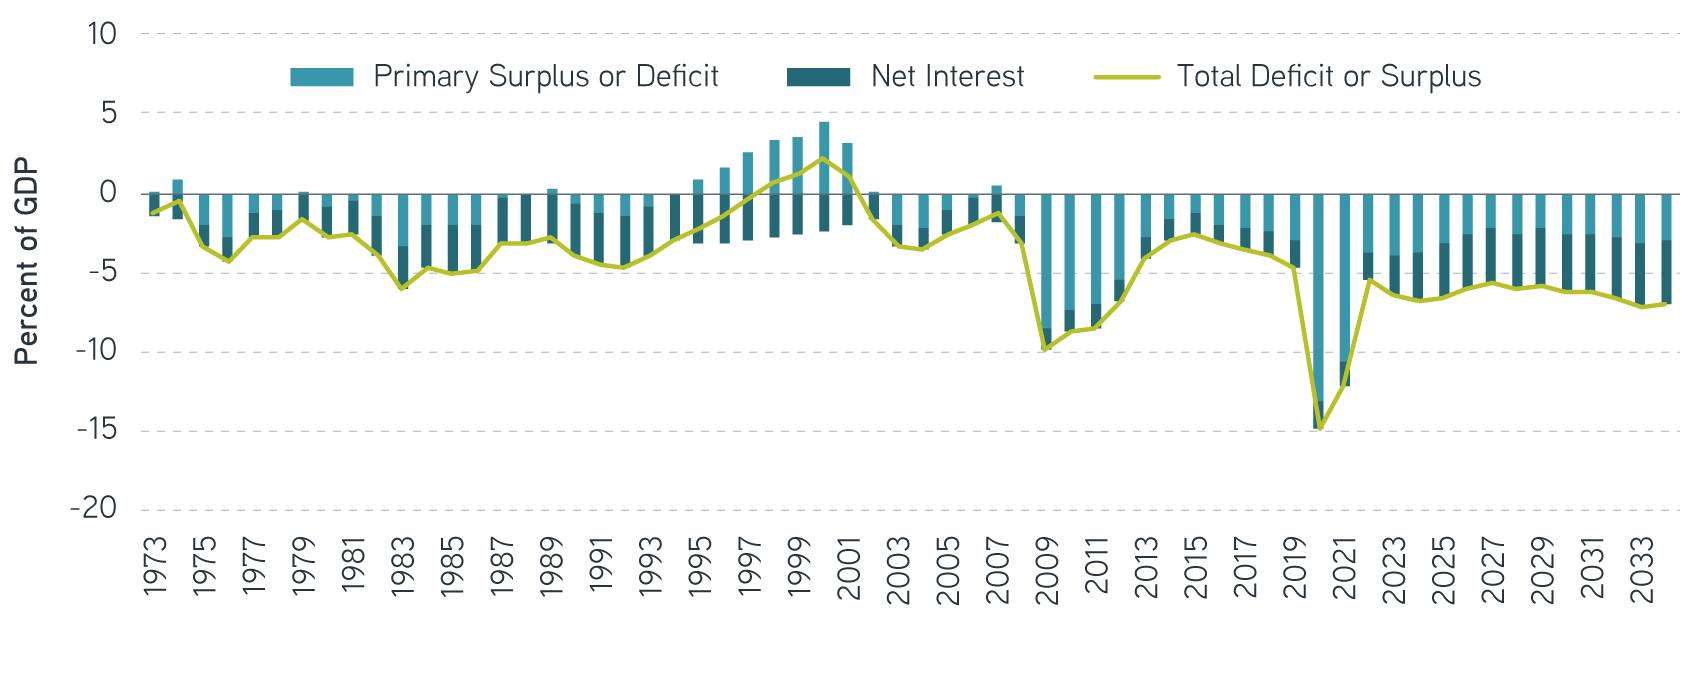
Source: Congressional Budget Office, data as of June 18, 2024.
Solutions for today’s complex interest rate environment
Deficits persisting as government outlays exceed tax revenues
Entitlement spending largely drives the unsustainable trajectory of government debt. The federal budget is split between mandatory spending set by existing law —such as social security, Medicare and Medicaid—and discretionary spending set through annual appropriations bills—such as defense. Over the past 40 years, mandatory spending has grown from 45% to 66% of the federal budget. Demographic changes have increased the ratio of beneficiaries to the working-age population, while healthcare cost increases have outpaced broader inflation.
Although government spending has exceeded 20% of GDP each year since 2008, tax revenues have mostly remained at 15% to 19% of GDP since the 1970s—aside from two years during the global financial crisis (GFC) when they were lower. Maintaining benefits provided by mandatory spending is the law, but it’s also a choice to expand government given demographic changes. Without additional revenue, federal trust funds for Social Security and Medicare are approaching insolvency over the coming decade.1 Entitlement spending and net interest account for over 90% of the projected growth in federal outlays through 2034.
Entitlement spending and net interest add largest increments to projected increases in spending
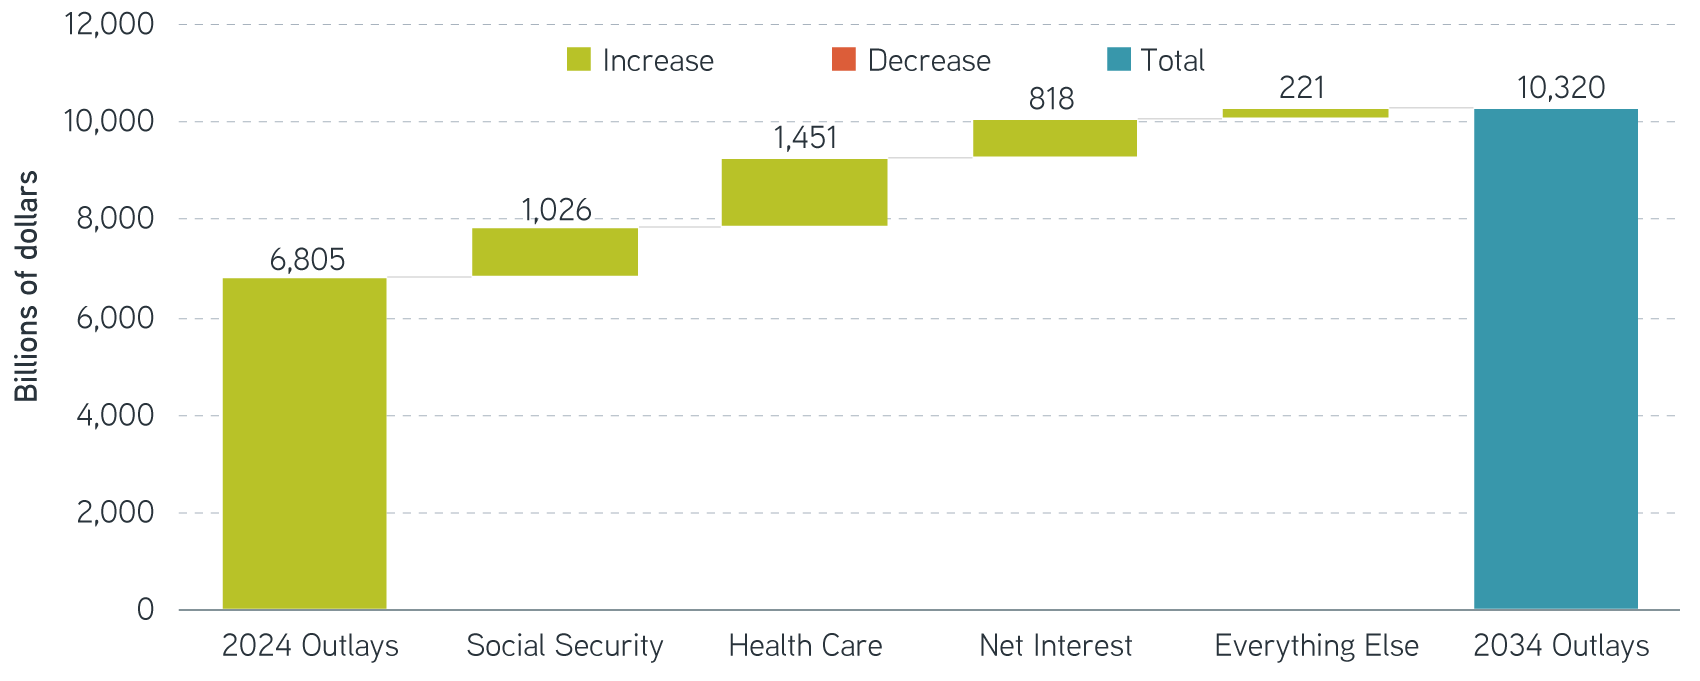
Source: Congressional Budget Office, data as of June 18, 2024.
Fiscal policy even more challenging in a polarized Congress
Following the GFC in 2008, political will to address public sector debt gained momentum. The sovereign debt in Europe crisis led to austerity measures across the region. In 2010, President Obama appointed the bi-partisan Bowles-Simpson commission to seek fiscal solutions for the US. According to CBO estimates, the commission’s proposals for new revenue and spending cuts in roughly equal parts could have brought the budget deficit below 1% over eight years.
Proposed changes included new revenues from taxing capital gains and dividends as ordinary income, along with increasing the income cap on taxable wages and raising the social security retirement age to 69 over time. To reduce cost increases, benefits would be indexed to chain-weighted CPI, which captures changes in consumer preferences and substitution effects. Only 11 of 18 commission members signed off on these proposals, however, and they never made it to Congress.2
Today, politics are increasingly polarized, with impacts that are challenging to quantify but reflected in the legislature’s difficulty when approving an annual budget each year. Discretionary spending is funded through a series of appropriations bills due at the beginning of the fiscal year—a deadline Congress hasn’t met since 1997. When Fitch downgraded US sovereign debt, the ratings agency cited just such a “deterioration in standards of governance over the last 20 years.”
Legislative action and market reaction
Recent attempts to address the debt have focused on discretionary spending, which is 28% of the budget. The Fiscal Control Act of 2023 (FCA) was the most significant legislation since 2011, but it resulted in just 1% discretionary spending cuts in 2024. Raising revenues or addressing entitlement spending remains especially challenging politically.
Debt ceiling and expiring provisions for the Tax Cut and Jobs Act could be catalysts for legislative action in 2025. Extending the TCJA would add approximately $4 trillion to the nation’s debt over 10 years. Suspended by the FCA, the debt ceiling will be reinstated in January. Recall that the Budget Control Act of 2011, the Bipartisan Budget Act of 2019 and the FCA all coincided with debt ceiling debates or government shutdowns.
In recent budget standoffs, investors may have become inured to the political brinksmanship in the US. Yet the issue of fiscal sustainability has reached a tipping point in other regions. In 2022, for example, the “mini-budget” fiscal package from new Prime Minister Liz Truss sent UK currency and rates markets into turmoil, and her premiership lasted only 49 days.
The bottom line
Such outcome is less likely in the US, with the status as global reserve currency and role in global commerce supporting demand for both dollars and Treasurys. But over time, borrowing costs could rise, and the increasing share of the budget going to debt service could limit economic growth. We would argue that the runway for action may be limited, and failure to act could have meaningful consequences. In part two, we’ll investigate the dynamics of supply and demand in the Treasury market.
1 Funding for Social Security and Medicare will run out in 11 and 12 years, respectively—potentially triggering 21% spending cuts to Social Security and leaving Medicare underfunded by 11% annually.
2 Some ideas to cap discretionary spending did make it into the Budget Control Act of 2011 (BCA), which later resulted in the spending sequester of 2013. According to the CBO, fiscal measures that year shaved more than 1% off GDP growth, but the BCA largely omitted Bowles-Simpson measures that addressed new revenue sources or mandatory spending cuts.
The views expressed in these posts are those of the authors and are current only through the date stated. These views are subject to change at any time based upon market or other conditions, and Parametric and its affiliates disclaim any responsibility to update such views. These views may not be relied upon as investment advice and, because investment decisions for Parametric are based on many factors, may not be relied upon as an indication of trading intent on behalf of any Parametric strategy. The discussion herein is general in nature and is provided for informational purposes only. There is no guarantee as to its accuracy or completeness. Past performance is no guarantee of future results. All investments are subject to the risk of loss. Prospective investors should consult with a tax or legal advisor before making any investment decision. Please refer to the Disclosure page on our website for important information about investments and risks.