

We believe cheaper valuations, solid credit fundamentals and low correlations to equities make municipals attractive in the current environment.
Bonds have gained as investors sought shelter amid growing fears around a tariff-driven global economic slowdown. However, municipals have underperformed the broader bond rally. As we see it, they now offer some of the most compelling value in the past couple of years.
When viewed over longer horizons, municipals and comparable taxable bonds have generally moved in similar fashion. Yet there have been months and even quarters when they have diverged significantly. In the first quarter of 2025, Muni bonds underperformed comparable taxable bonds by the widest margin for a three-month period since 2020. This underperformance continued as US Treasurys gained from a tariff-driven rally over the beginning of April. Year to date though April 8, the Bloomberg Municipal Bond Index was down -1.63%, underperforming the Bloomberg US Treasury and US Corporate Indexes, which were up 3.08% and 1.13%, respectively.
Macro uncertainty fueling a flight to quality
Growth expectations have moderated amid uncertainty around the impact of larger-than-expected US tariffs and the potential for a wider trade war. With lawmakers increasingly focused on curbing federal deficits and debt, markets have also recognized the potential for less fiscal stimulus going forward. Both are weighing on sentiment and contributing to the risk-off mood.
- Economists expect that tariffs will lift inflation and slow growth; some are raising the risk of a US/global recession this year above 50%.
- The S&P 500® Index suffered its worst quarter since 2022, quickly followed by the worst two-day rout since March 2020. The Nasdaq 100 has entered a bear market.
- US Treasury yields have declined 20 to 50 basis points (bps) year to date as investor sought safe havens.
- However, short-dated Muni yields haven’t kept up with US Treasurys. In fact, longer Muni yields have headed in the opposite direction, with 20-year and 30-year yields up approximately 50 bps.
Display 1: Year to Date Yield Changes
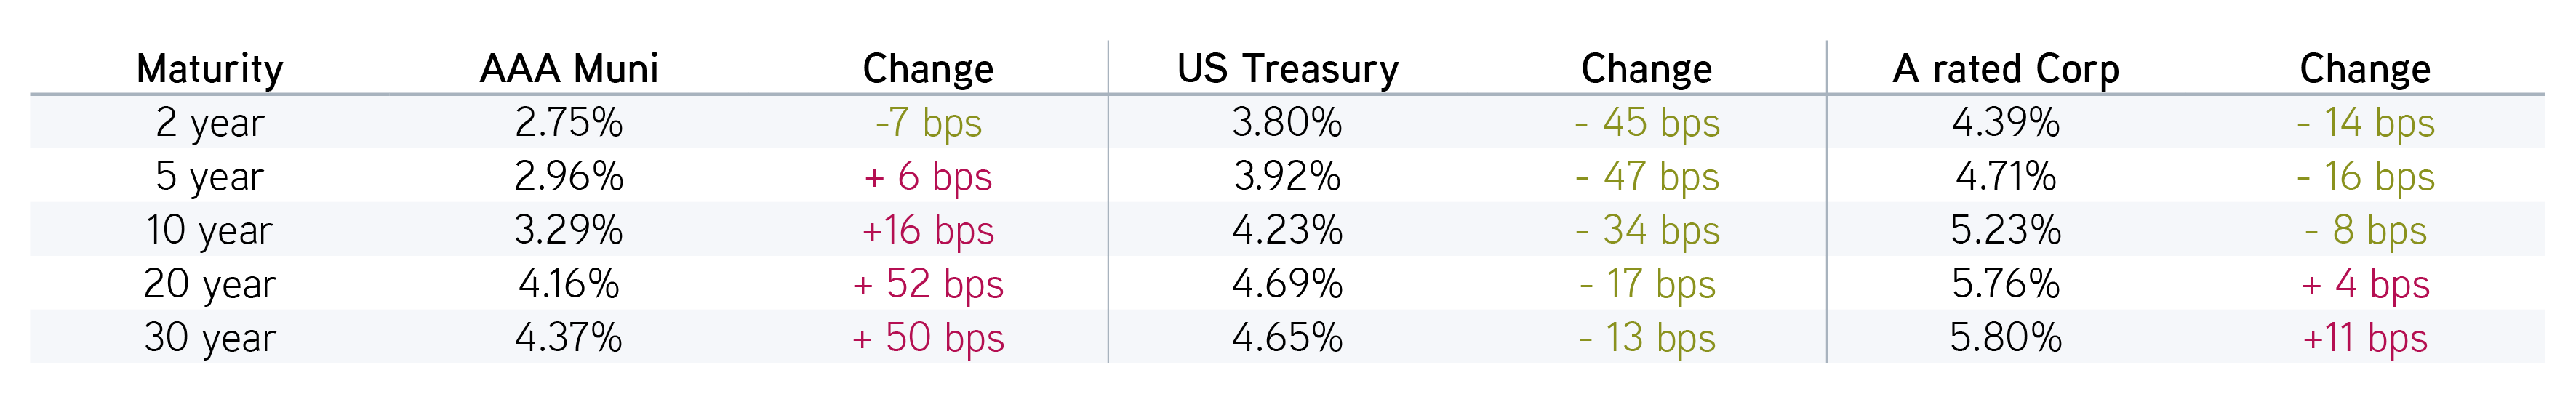
Source: Bloomberg BVAL Curves data as of 04/08/2025 from Bloomberg’s Evaluated Pricing service. For illustrative purposes only. Not a recommendation to buy or sell any security.
Relative yield move has brought Munis into cheaper territory versus taxables
The 10-year Muni/Treasury yield ratio now stands at 78%—the cheapest level since November 2022. The 20-year Muni/Treasury ratio is approaching 90%. Tax adjusted yields for solid AA/A rated munis are in the 5% to 8% range, offering 100 to 200 bps more yield relative to comparable corporates.
Display 2: Comparison of Municipal and Corporate Yields
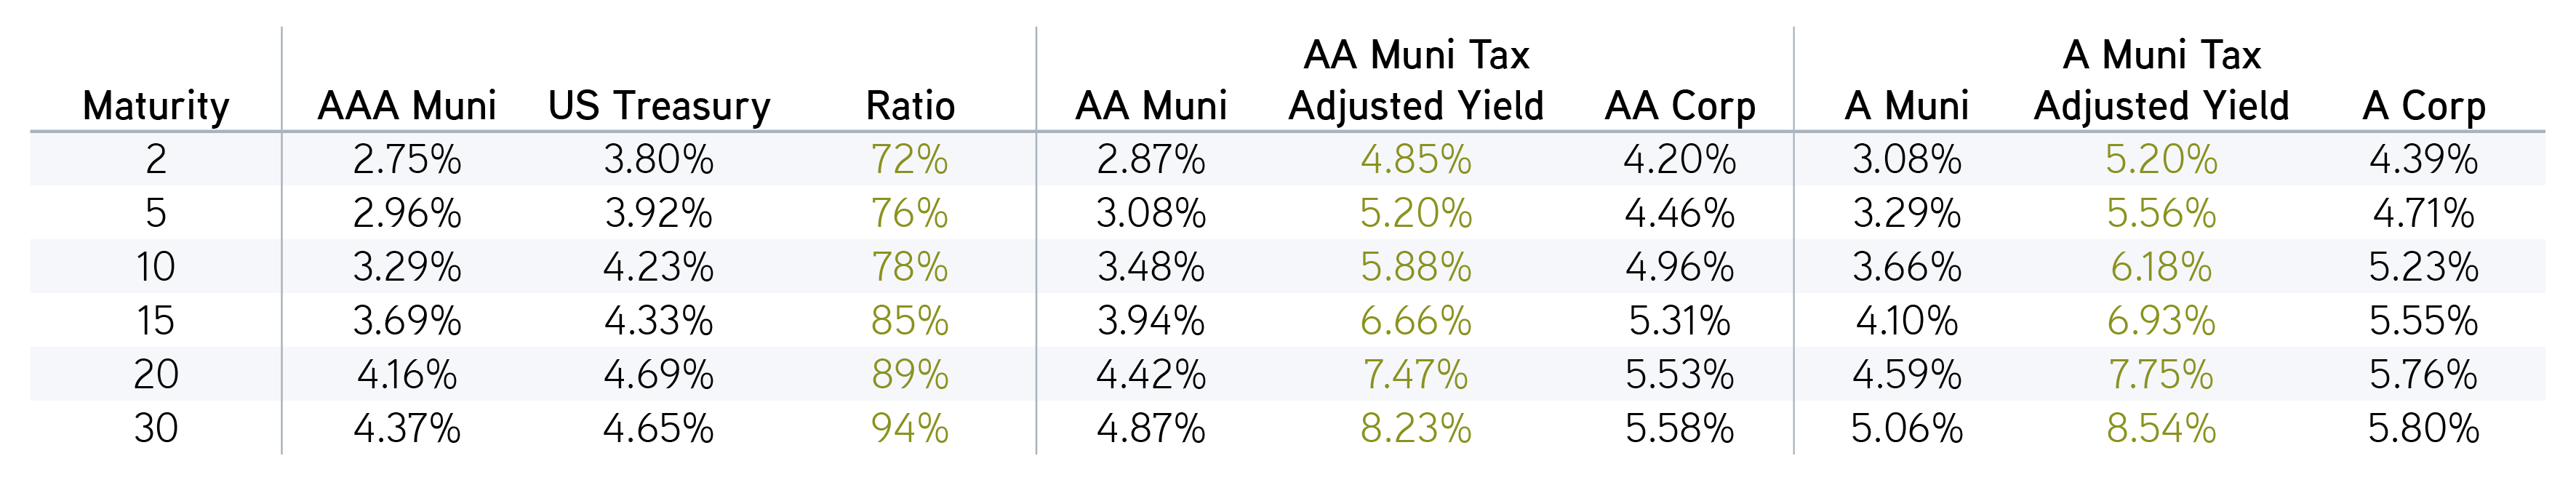
Source: Bloomberg BVAL Curves data as of 04/08/2025, tax adjusted yield (TEY) assumes tax rate of 40.8%. For illustrative purposes only. Not a recommendation to buy or sell any security.
Muni curve has steepened—investors are being paid to extend
As the municipal yield curve steepened dramatically to start the year, investors are being paid to extend. For example, a 2-year Muni has decreased 7 bps year to date, while a 20-year Muni has increased 52 bps. The slope of the 2 to 30 curve in the Muni market is 162 bps, which compares quite favorably to US Treasurys, where the slope is only 86 bps. A 20-year AAA Muni is only 20 bps away from the decade high reached in November 2023, while 20-year A/AA bonds are approaching 4.50%, equivalent to 7.50% to 8% taxable equivalent yields—equity like returns with fixed income risks.
With yields near a decade high, we see potential opportunity in stepping out of cash and getting some duration in the portfolio.
Display 3: Current Yield Curve Spreads

Source: Bloomberg BVAL Curves data as of 04/08/2025. For illustrative purposes only. Not a recommendation to buy or sell any security.
Boost bond potential with active tax management
What are the drivers behind the move?
We would attribute cheaper valuations, a steeper curve and any related underperformance to a combination of poor technical factors and headline risk.
Technical factors. The muni market has witnessed elevated issuance to start the year, with more than $130 billion coming to market through April 8—up 23% year over year. This surge in supply came at a time with reduced seasonal reinvestment flows from maturities, calls and coupons—typical over March and April. The weakness was further exacerbated by some tax-time selling and programmatic portfolio rebalancing in the wake of the equity drawdown. Bid wanted volume on April 7 reached the second highest daily level on record—next to what was witnessed during the Covid-related weakness. An uptick in fund outflows have also helped cheapen the market, with Lipper reporting outflows for four consecutive weeks.
Headline risk. Another factor that’s harder to parse out has been the impact of an uptick in media coverage around the potential threat to the tax exemption on municipal bond interest. As lawmakers look for revenue to pay for an extension of the Tax Cut and Jobs Act, the possibility of modifying the exemption is being discussed. We’ve commented on this in a previous blog. In the end, we view the likelihood of the tax exemption getting eliminated entirely as low. Yet even the discussions have likely had an impact on the muni market.
The bottom line
We believe the recent underperformance witnessed in municipals may present opportunity for the remainder of the year. Municipals are well positioned to weather a potential economic slowdown. Municipal credit has remained on a solid footing. State tax revenue increased over 2024, and rainy-day funds remain near an all-time high. The positive ratings trend in municipals continued last year, with upgrades exceeding downgrades for the fourth straight year. We see potential opportunity in stepping out of cash and getting some duration in a portfolio, given the relative value we observe in the intermediate and long end of the curve.
Over the past five years, equities have outperformed their longer-term historic averages. Bonds have been doing the opposite. Mean reversion may be underway in the equity markets. With starting yields now above longer-term averages and growth concerns emerging, we believe bonds have the potential to outperform equites over 2025—offering income, total return and diversification.
Parametric’s Laddered Interest Rate Scenario Tool helps investors explore the performance of municipal, corporate and Treasury bond portfolios in changing rate environments.
Parametric and Morgan Stanley do not provide legal, tax or accounting advice or services. Clients should consult with their own tax or legal advisor prior to entering into any transaction or strategy.
The views expressed in these posts are those of the authors and are current only through the date stated. These views are subject to change at any time based upon market or other conditions, and Parametric and its affiliates disclaim any responsibility to update such views. These views may not be relied upon as investment advice and, because investment decisions for Parametric are based on many factors, may not be relied upon as an indication of trading intent on behalf of any Parametric strategy. The discussion herein is general in nature and is provided for informational purposes only. There is no guarantee as to its accuracy or completeness. Past performance is no guarantee of future results. All investments are subject to the risk of loss. Prospective investors should consult with a tax or legal advisor before making any investment decision. Please refer to the Disclosure page on our website for important information about investments and risks.
04.08.2026 | RO 4373040