

Volatile interest rates have spurred investment capital into motion. Clients often ask where they should allocate on the yield curve. Our answer is not always simple, as each client has different objectives and risk tolerances, so we urge them to consult with their financial advisors. But what historical experience suggests to us is that yield volatility can vary along different parts of the curve, largely driven by duration.1
Over the past four years, we have seen the Bloomberg US Generic Govt 10 Year Index yield below 1% and close to 5%, challenging investors and asset allocators. This year the Federal Reserve is clearly intent on normalizing the yield curve. Money market fund yields have already declined from levels not reached since 2007, and investors have taken notice.
Bond funds are on pace for a record year of inflows. More than $590 billion has been allocated to bond mutual funds and ETFs so far this year,2 with additional flows going to fixed income separately managed accounts (SMAs). Parametric Fixed Income SMAs are also on track for record inflows, with more than $10 billion entering our strategies on a net basis through September 30.3
History shows us that when the Fed is cutting rates, the front end of the yield curve often responds more directly than the long end of the curve. Here are the previous cutting periods, where multiple cuts occurred:
20 years of Fed cuts
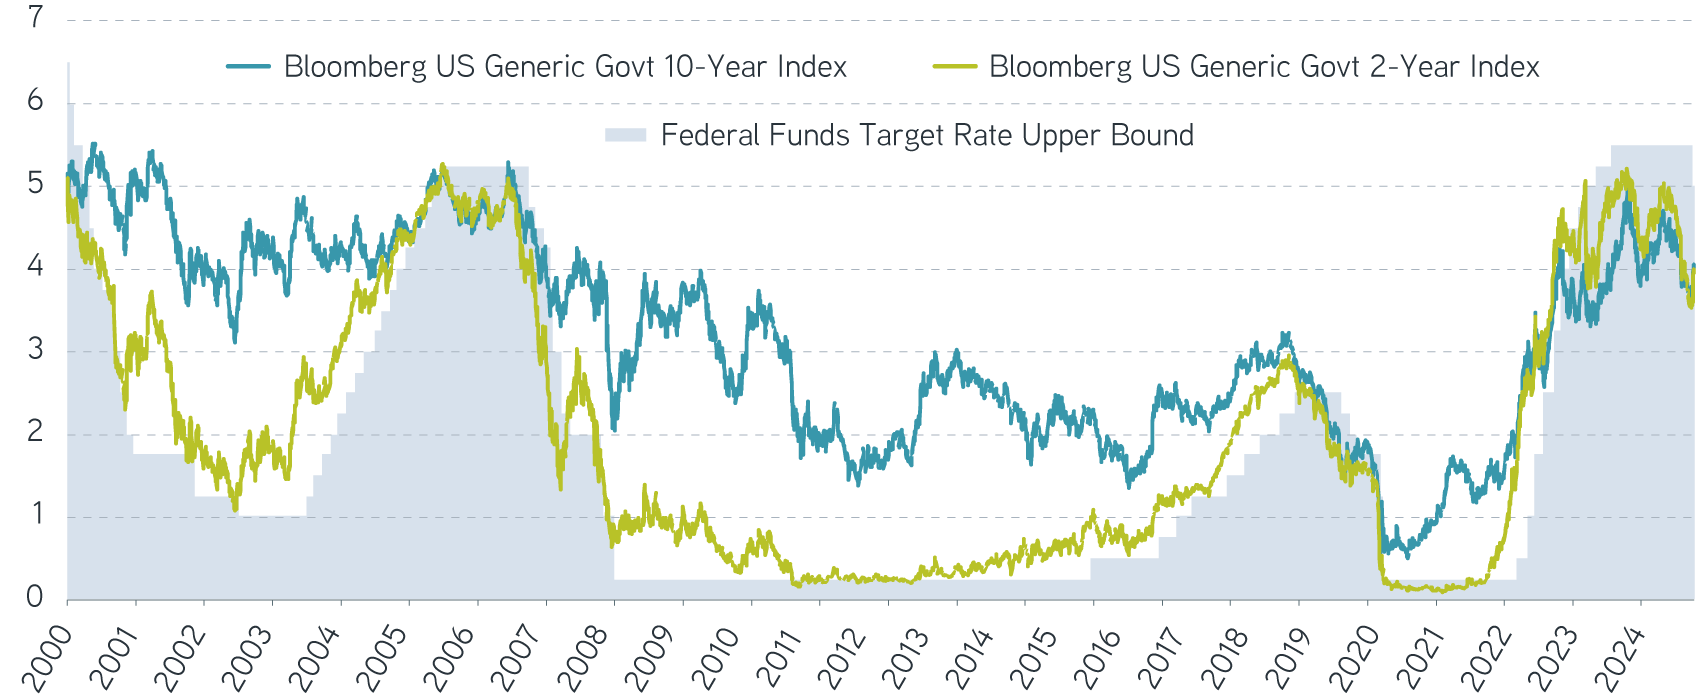
Source: Bloomberg as of 10/9/2024. For illustrative purposes only. Not a recommendation to buy or sell any security. All investments are subject to risk, including risk of loss. It is not possible to invest directly in an index. Indexes are unmanaged and do not reflect the deduction of fees or expenses.
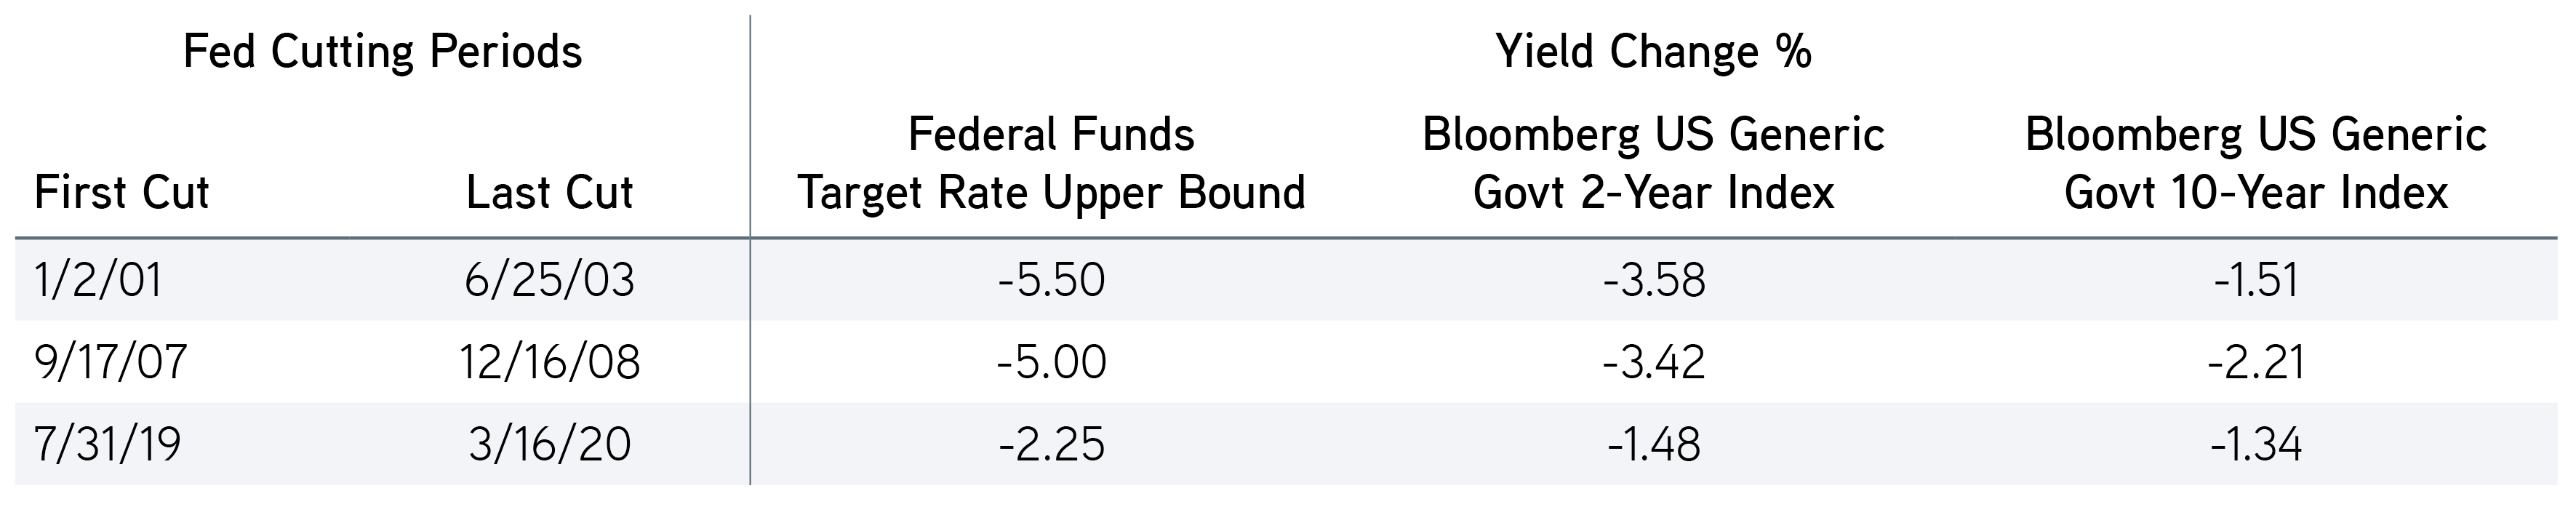
Source: Bloomberg as of 10/9/2024. Cutting periods defined as the first rate cut announcement by the Federal Open Markets Committee to the last cut in the fed funds rate. For illustrative purposes only. Not a recommendation to buy or sell any security. All investments are subject to risk, including risk of loss. It is not possible to invest directly in an index. Indexes are unmanaged and do not reflect the deduction of fees or expenses.
On average over these Fed rate cutting periods, the Bloomberg US Generic Govt 2 Year Index yield declined by 283 basis points from the first cut to the last cut, while the Bloomberg US Generic Govt 10 Year Index yield declined by 169 basis points. On the surface, an investor may be drawn to the front end of the curve, where yields have historically declined more. However, it’s important to remember that duration matters when considering returns.
The ICE BofA Current 10-Year US Treasury Index outperformed the ICE BofA Current 2-Year US Treasury Index in all three periods.4 In fact, the average outperformance across those periods is over 6%! During periods of interest rate changes, we believe that duration may be the most significant factor determining overall index performance.
As of October 8, the ICE BofA Current 2-Year US Treasury Index has a yield of 3.96% and a duration of 1.88 years. The ICE BofA Current 10-Year US Treasury Index has a yield of 4.02% and a duration of 8.06 years.5 If we estimate rate changes from this moment forward over the next 12 months, then we can analyze the impact on these two indexes:
Estimated index returns with different rate changes from October 2023 to October 2025
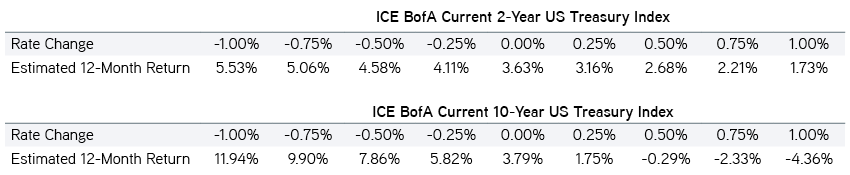
Source: Parametric as of 10/8/2024. Rate change assumed over a 12-month period. Index return calculated by the index yield plus the expected price return of the index. Price return is measured by the current duration of the index multiplied by the range of projected yield changes. These examples are for illustrative use only and are not actual results. It is not possible to invest directly in an index. Indexes are unmanaged and do not reflect the deduction of fees or expenses.
Based on these index rates and assuming a yield change over the next 12 months, a 25 basis point move lower in the ICE BofA Current 10-Year US Treasury Index yield would have a larger impact on performance than a 100 basis point reduction in the ICE BofA Current 2-Year US Treasury Index yield.
History suggests that we won’t get a parallel shift of yield curve, but on average, the decline of the ICE BofA Current 10-Year US Treasury Index yield is only 59% of the decline in the ICE BofA Current 2-Year US Treasury Index yield. This type of performance may have the potential to produce significantly higher total returns for the ICE BofA Current 10-Year US Treasury Index. Duration matters in the face of declining interest rates.
Solutions for today’s complex interest rate environment
The bottom line
The Fed announced a 50 basis point cut to the federal funds rate on September 18, with a pledge to normalize rates going forward. If that effort is successful, and interest rates decline across the curve, we anticipate that longer duration portfolios could outperform—even if the curve shift isn’t parallel. Over the next 12 months, if 2-year US Treasury yields decline by 100 basis points and 10-year US Treasury yields decline by 25 basis points, we expect the 10-year US Treasury bond could still outperform.
1 Duration measures the sensitivity of a bond’s price to changes in interest rates.
2 Source: Investment Company Institute as of 9/25/24.
3 Source: Parametric as of 9/30/2024.
4 Source: Bloomberg.
5 Source: Bloomberg as of 10/8/2024.
The views expressed in these posts are those of the authors and are current only through the date stated. These views are subject to change at any time based upon market or other conditions, and Parametric and its affiliates disclaim any responsibility to update such views. These views may not be relied upon as investment advice and, because investment decisions for Parametric are based on many factors, may not be relied upon as an indication of trading intent on behalf of any Parametric strategy. The discussion herein is general in nature and is provided for informational purposes only. There is no guarantee as to its accuracy or completeness. Past performance is no guarantee of future results. All investments are subject to the risk of loss. Prospective investors should consult with a tax or legal advisor before making any investment decision. Please refer to the Disclosure page on our website for important information about investments and risks.
10.21.2025 | RO 3928334