


Elevated budget deficits imply growing US Treasury issuance. Receding demand from central banks could leave more price-sensitive buyers to pick up the slack. Who are the buyers of US government debt, and how is the market responding? In part two of our series, let’s examine Treasury market supply and demand.
In Ernest Hemingway’s 1926 novel, The Sun Also Rises, a character is asked how he went bankrupt. “Two ways,” he replies. “Gradually, then suddenly.” While we don’t envision that outcome for the US, investors shouldn’t ignore the issue of excessive government borrowing. A more apt quote may come from A Farewell to Arms, where Hemingway writes that “a writer’s job is to tell the truth.” Whatever the outcome of November’s elections, US debt and deficits appear to be on an unsustainable trajectory.
Anticipated Federal Reserve rate cuts may have shifted investor attention from Treasury supply, but the topic could reemerge as the debt ceiling is reinstated in January. We summarized some of the nation’s fiscal challenges in our previous blog: The US will run budget deficits over 6% for the next 10 years, and interest expense will surpass defense spending in 2024, according to recent Congressional Budget Office (CBO) estimates. This deficit will get funded through issuance of US Treasury bills, notes and bonds. Market impacts remain subtle, but investors should monitor debt auctions and long-term yields as debt and deficits continue to rise.
Demand: Got $10 trillion to spare?
The main players in the market for Treasurys include US and international government entities, banks, investment firms and households. The Treasury will rely on them all for a record amount of debt issuance in the coming year. Over eight trillion US dollars in bonds, notes and T bills will mature in the next 12 months, and CBO budget estimates imply an additional $2 trillion in borrowing needs this year.1
Of the $35 trillion in Treasury debt currently outstanding, intragovernmental agencies own over $7 trillion—primarily in trusts for Social Security, Medicare and government employee retirement funds. The balance of nearly $28 trillion, which is referred to as marketable debt or net government debt, is approaching the level of US GDP.
The largest holder of marketable debt is the Federal Reserve, accumulating over $5 trillion in Treasurys at their peak in 20222 as the central bank doubled the size of its balance sheet during the pandemic. With the Fed now reducing Treasury and mortgage-backed security (MBS) holdings, demand will need to come from other buyers.
Media attention tends to focus on non-US buyers, even though foreign ownership of Treasurys has declined from a peak of 33% in 2013 to 23% of outstanding debt today. China now owns less than 3% of outstanding par, down from 9% in 2011. European demand—led by the UK3—has increased, but not enough to reverse this trend. Investors outside the US remain significant buyers, albeit at lower levels than before the global financial crisis, when trade surplus countries plowed reserves into Treasurys.
Over half of foreign Treasury holdings are held by government sources. Through trade, countries may end up with US dollars that get parked in government bonds, and central banks buy Treasurys to manage foreign reserves. While changes in currency and trade policy may impact foreign demand at the margin, the dollar has been the dominant global reserve currency since World War II and is likely to remain so.
On the domestic side, banks and state and local governments stepped in during the early stages of the pandemic, but their buying has declined more recently. As Treasury supply surged in 2020 and 2021, and stimulus flooded the economy, banks were flush with deposits. With lower loan demand at the onset of the pandemic, banks reinvested much of those deposits into securities, including US Treasurys. After interest rates spiked higher in 2022, US banks were sitting on paper losses of over $600 billion, according to the FDIC. As those Treasurys mature, and banks wait for losses to roll off, their demand has receded.
That leaves domestic buyers—such as households and funds—with greater responsibility for financing incremental supply. Money market funds added over $1 trillion in Treasurys in 2023, deploying reverse repurchase agreement (RRP)4 balances into Treasury bills, which have exceeded 20% of Treasury supply over the past year. Individuals added $1.9 trillion in Treasury holdings from 2021 to 2023.5 As government ownership declines, a more price-sensitive buyer could put upward pressure on borrowing costs out the curve.
Ownership Breakdown of $34 Trillion US Treasury Debt
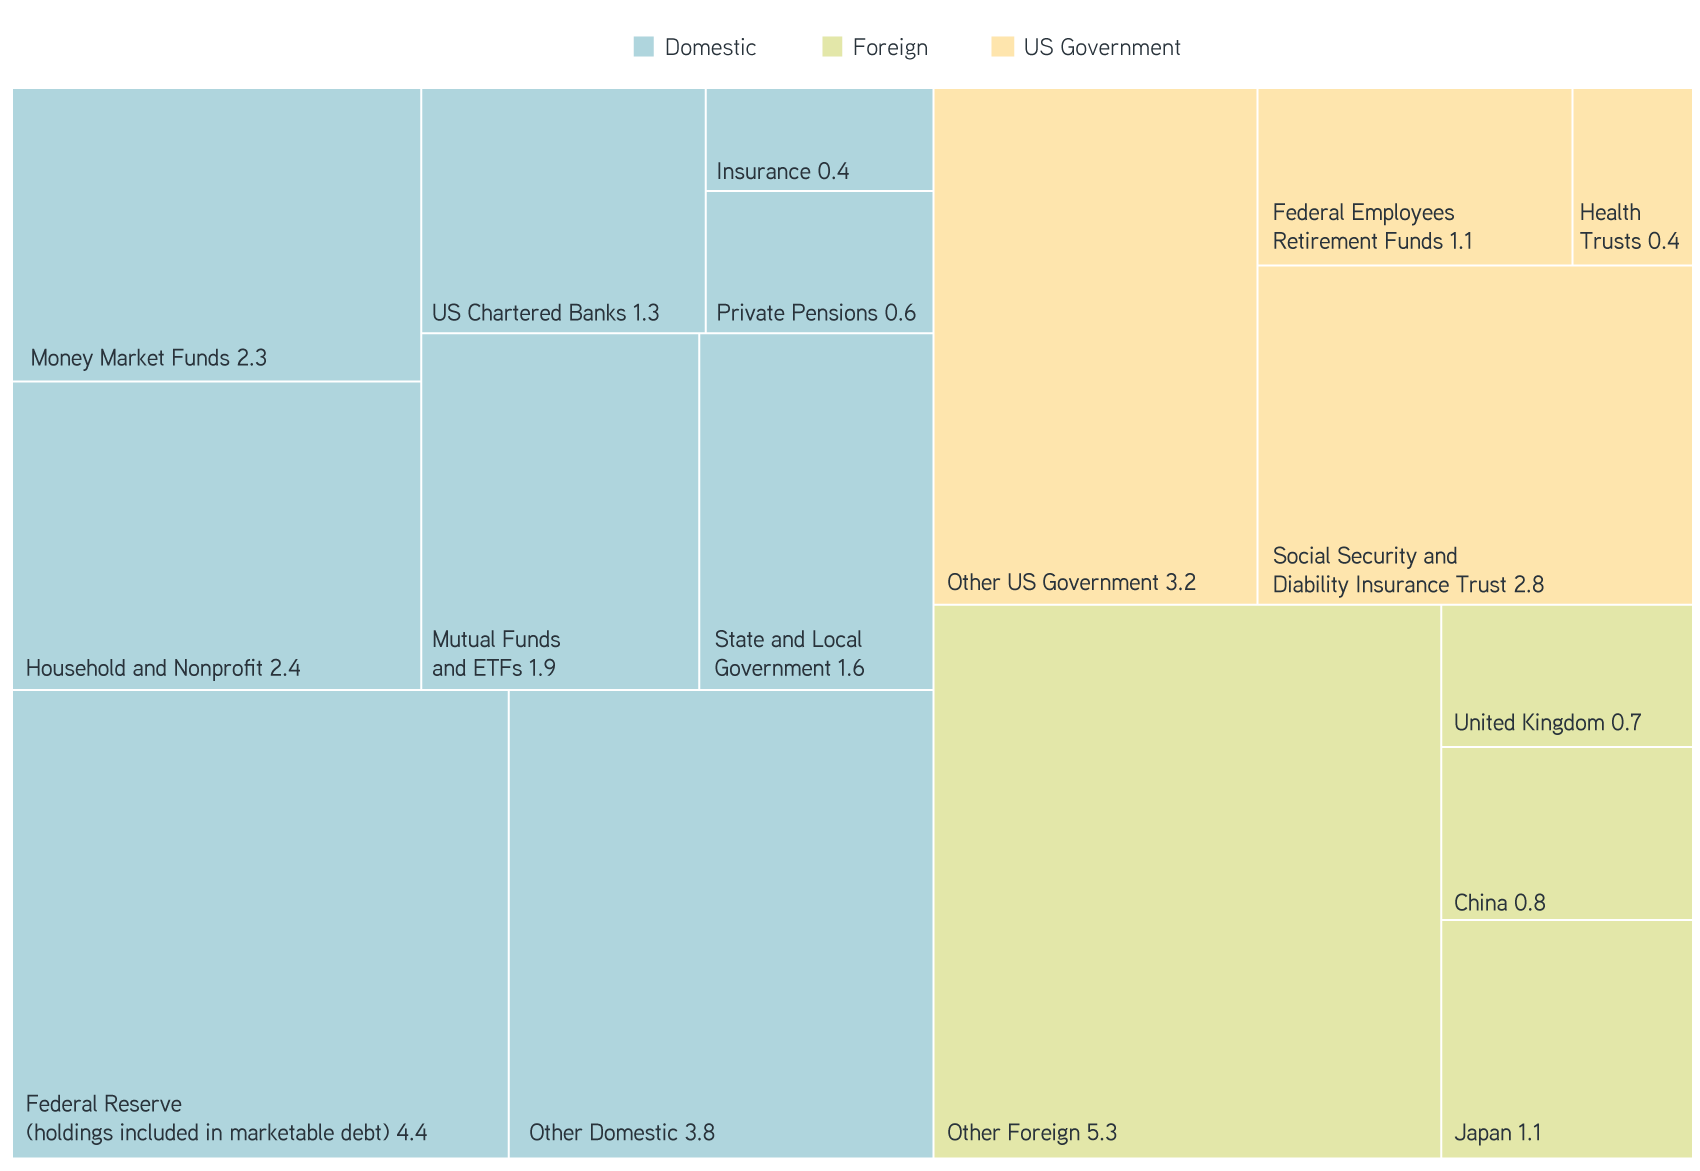
Sources: Bureau of the Financial Service, Treasury Bulletin. US Treasury, Treasury International Capital Data. Federal Reserve, Financial Accounts of the United States. All data as of 12/31/2023.
Term premium: Moving on up
While the Fed sets short-term yields through the federal funds rate, long-term Treasurys are influenced by a broader set of factors, including GDP growth and inflation expectations, as well as term premium, which is defined as the compensation investors earn by owning longer-maturity securities instead of rolling short-term securities over an equivalent time period. The theory is that longer duration means higher volatility, so investors should earn an excess return—a positive term premium.
That isn’t always the case. Uncertainty around macroeconomic factors as well as simple supply and demand can influence the term premium. Increased demand for savings from aging populations and economies with a global trade surplus has depressed the term premium over time. Quantitative easing after the global financial crisis, and again during the pandemic, helped drive term premium estimates below zero.
Term premium is an intuitive concept. Measuring it precisely is more challenging because it is implied based on an expected rolling risk-free rate, which can be estimated in multiple ways. For instance, the New York Fed uses market rates for its term premium estimate, while the Philadelphia Fed’s estimate is based on market participant surveys. Nevertheless, estimates of term premium have moved higher since 2021, as demonstrated in the Kim-Wright and Adrian-Crump models from the New York Fed.
10 Year Treasury Term Premium Estimates
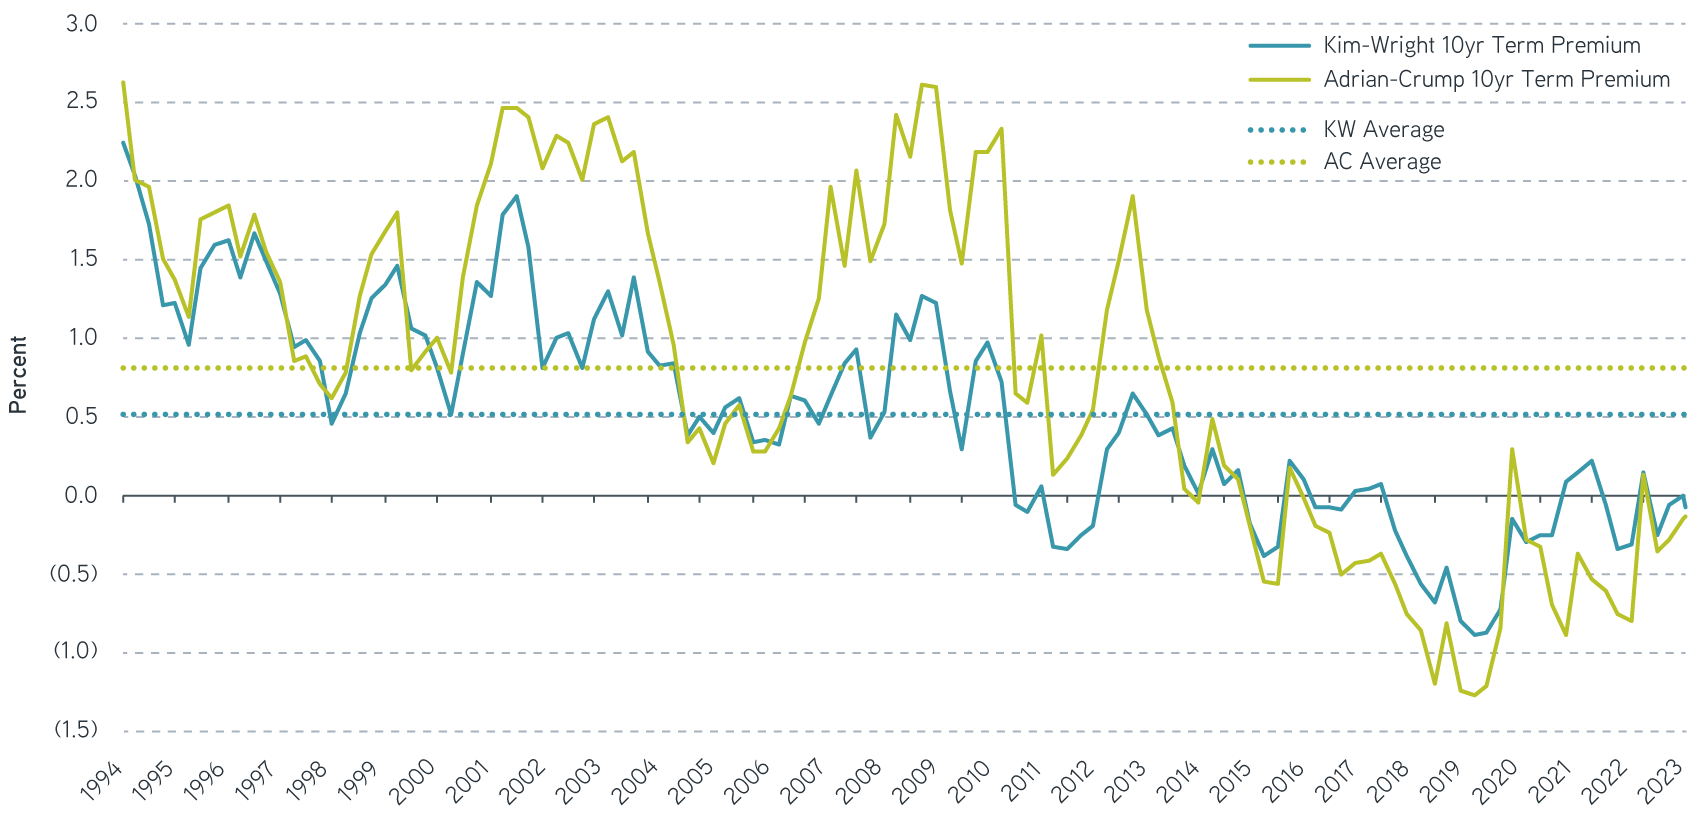
Source: Bloomberg, data as of July 17, 2024. For illustrative purposes only. Not a recommendation to buy or sell any security. All investments are subject to risk, including risk of loss.
With supply increasing and the Fed receding as a buyer of Treasurys, the term premium could continue to revert to historical levels. Following the debt ceiling debate last summer, the Treasury increased auction sizes to refill their general account and meet budgetary spending needs. After the 10-year Treasury hit 5% last fall, Fed minutes from the October FOMC meeting acknowledged the increase in long-term yields “appeared mostly attributable to higher term premiums.”6
Elections have consequences, and the bond market could take notice this fall. Policies challenging Fed independence, the value of the dollar or the trajectory of fiscal policy could influence long term Treasury rates through higher inflation expectations and term premium. The flat shape of the yield curve today reflects the restored credibility of the Fed’s fight on inflation and still modest term premiums for longer maturity Treasurys.
Supply: Only higher from here
Despite higher issuance, auctions continue to perform well, and the Treasury can adjust to meet market demand. The process begins with the quarterly refunding announcement, in which the Treasury updates investors on the auction schedule, financing needs and changes in policy that are under consideration. A group of market participants on the Treasury Borrowing Advisory Committee (TBAC) advises the Treasury, which ultimately makes the supply decisions.
The Treasury seeks to maintain a regular and predictable pattern of debt issuance that minimizes interest cost to the taxpayer. While short-term instruments like Treasury bills (T-bills) can have lower costs over time, the Treasury balances interest cost with rollover risk by staggering maturities across the curve. When borrowing needs change unexpectedly, adjustments to T-bill issuance can act as a shock absorber, allowing for more regular coupon issuance.
When an auction is announced, securities will begin trading on a when-issued basis, which allows for price discovery by investors. If the auction results in a higher yield than the when-issued rate immediately preceding the auction, this difference is known as a tail—a signal of weak demand.
The Treasury and TBAC consider other factors as indications of demand:
- Allocation to primary dealers—financial institution intermediaries approved to trade directly with the Treasury, who are obliged to bid to absorb excess supply.
- Bid/cover ratio—the amount bid for, versus the amount issued.
Back in 2001, the federal debt declined after a run of primary budget surpluses, and the Treasury stopped issuing the 30-year bond entirely. At that time, Treasury Secretary Larry Summers implemented a buyback program to support market liquidity. More recently, the Treasury scaled back auctions of the 20-year bond in 2022. And this year, the Treasury reinstituted the buyback program, targeting older vintage securities trading at small discounts to new issue Treasurys.
In 2024, auction sizes for coupon securities—that is, excluding T-bills—have mostly remained unchanged. The June update to the CBO’s budget forecast increased the deficit estimate by approximately $400 billion. Excluding non-cash adjustments, the difference in borrowing could be met with increased T-bill issuance, and coupon supply may remain constant in the immediate term. But persistent budget deficits imply rising auction sizes over time, as a growing stock of debt is refinanced each year.
10, 20 and 30 Year Treasury Auction Sizes and Tail/Stop
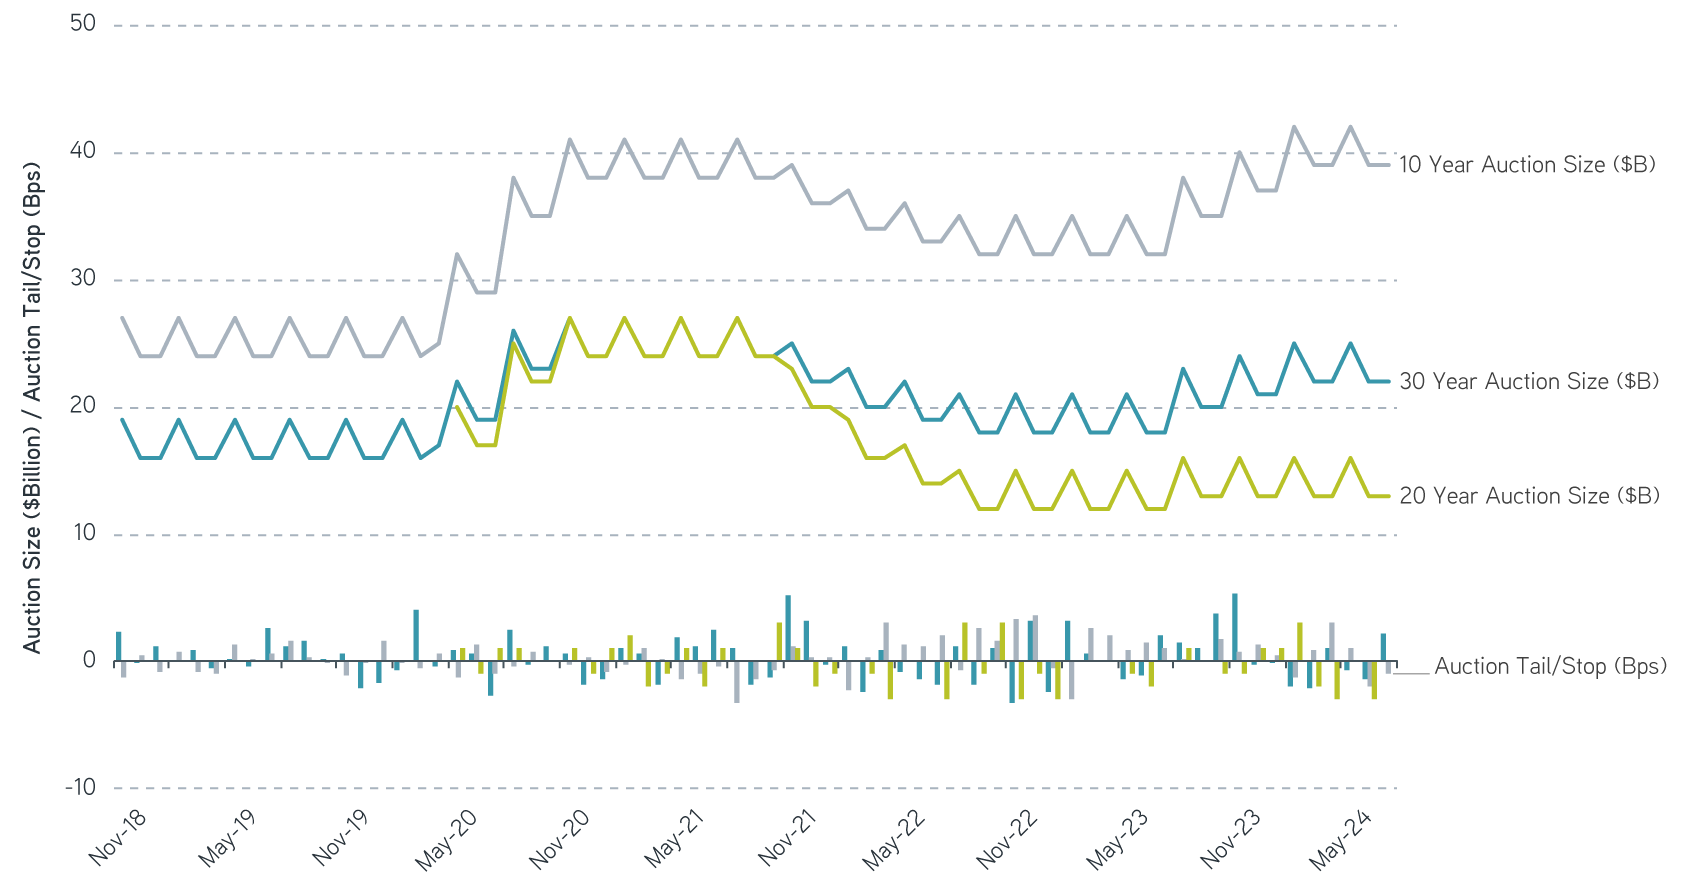
Source: Bloomberg, data as of July 17, 2024. Tail is the difference between the yield after auction and the when-issued rate before auction. For illustrative purposes only. Not a recommendation to buy or sell any security. All investments are subject to risk, including risk of loss.
Solutions for today’s complex interest rate environment
The bottom line
The US Treasury market continues to function smoothly as supply has increased, but a shifting buyer base could put upward pressure on the term premium. Barring budget reform, quarterly borrowing needs could increase next year and continue higher from there. Current CBO estimates have debt to GDP rising from just under 100% now to 122% in 2034, with debt held by the public increasing from $28 trillion to over $50 trillion. A specific debt threshold that would trigger market panic is unknowable—for example, Japan’s debt to GDP is above 200%. But elevated debt increases the economic burden and potential risks to financial stability. In part three, we’ll take a closer look at possible policy changes and what they could mean for the budget outlook and Treasury issuance.
1 Congressional Budget Office: An Update to the Budget and Economic Outlook: 2024 to 2034, June 18, 2024.
2 Bureau of the Fiscal Service: Treasury Bulletin, Previous Issues through March 2024.
3 US Department of the Treasury: Treasury International Capital (TIC) System.
4 A reverse repurchase agreement is a short-term agreement to sell securities in order to buy them back at a slightly higher price.
5 SIFMA Research: US Treasury Securities Statistics, July 8, 2024.
6 Board of Governors of the Federal Reserve System: Minutes of the Federal Open Market Committee, October 31–November 1, 2023.
The views expressed in these posts are those of the authors and are current only through the date stated. These views are subject to change at any time based upon market or other conditions, and Parametric and its affiliates disclaim any responsibility to update such views. These views may not be relied upon as investment advice and, because investment decisions for Parametric are based on many factors, may not be relied upon as an indication of trading intent on behalf of any Parametric strategy. The discussion herein is general in nature and is provided for informational purposes only. There is no guarantee as to its accuracy or completeness. Past performance is no guarantee of future results. All investments are subject to the risk of loss. Prospective investors should consult with a tax or legal advisor before making any investment decision. Please refer to the Disclosure page on our website for important information about investments and risks.
8.26.2025 | RO 3798182