

With the US presidential election quickly approaching, each day seems to bring more information about each candidate’s political agenda. We can understand why investors on both sides of the aisle might expect the outcome to impact financial markets. But the historical record suggests that elections may have less influence on markets than you think.
Here we dispel three common myths about elections and investments, demonstrating why we think sticking to a long-term investment plan might be a better path to success than trying to predict political cycles.
Myth 1: Stocks outperform during election years
False.
To refute this myth, we looked at the performance of the S&P 500 Index going back to 1928, which covers the last 24 presidential elections.
S&P 500 price return during election years
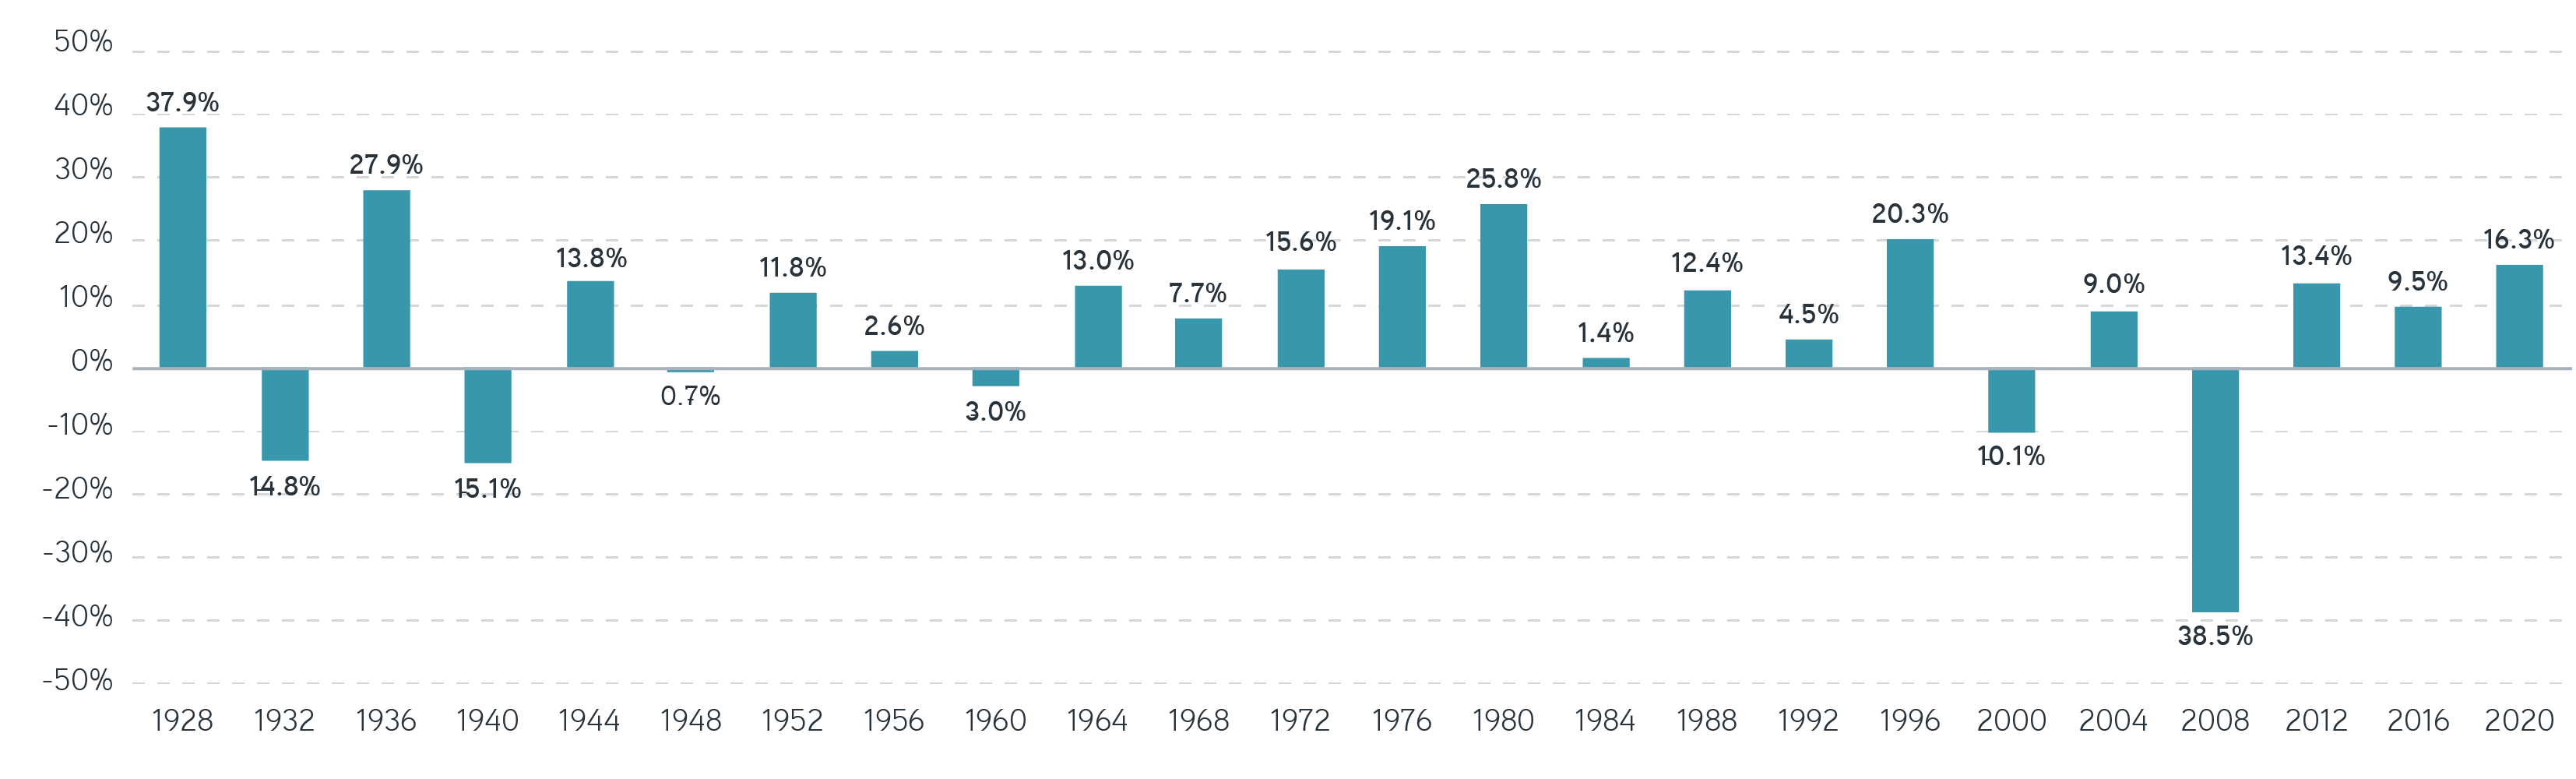
Source: S&P Dow Jones Indices LLC, Bloomberg, Parametric. Past performance is not indicative of future results. All investments are subject to risk, including risk of loss. It is not possible to invest directly in an index. Indexes are unmanaged and do not reflect the deduction of fees or expenses.
Since 1928, the S&P 500 has typically risen during US presidential election years. Of the 24 election years, the index was up during 18 of them, equating to a hit rate of 75%. The average return during these years was 7.5% with a volatility of 16.1%. So more often than not, the S&P 500 has risen during election years, which may tempt some investors to consider overweighting stocks every four years.
But not so fast. It turns out that the performance of the S&P 500 during election years has been remarkably similar to its performance during other years.
S&P 500 returns during election and non-election years

Source: S&P Dow Jones Indices LLC, Bloomberg, Parametric. Based on daily S&P 500 closing price levels. Volatility is calculated as the annualized standard deviation of the daily S&P 500 price return. Past performance is not indicative of future results. All investments are subject to risk, including risk of loss. It is not possible to invest directly in an index. Indexes are unmanaged and do not reflect the deduction of fees or expenses.
Using our S&P 500 calendar year data, we find that the average price return and volatility have been strikingly similar across election and non-election years. This suggests that whether a presidential election was occurring that year had little impact on the overall market performance.
Myth 2: Markets care who controls the White House
False.
It’s natural for investors to seek a connection between who wins the presidential election and which direction stocks will go in the years to come. We often hear claims that the market does better under one political party than the other. But a look back at history suggests that who is in the White House is only one of many things that can impact the market.
S&P 500 price return during Democratic (blue) and Republican (red) administrations
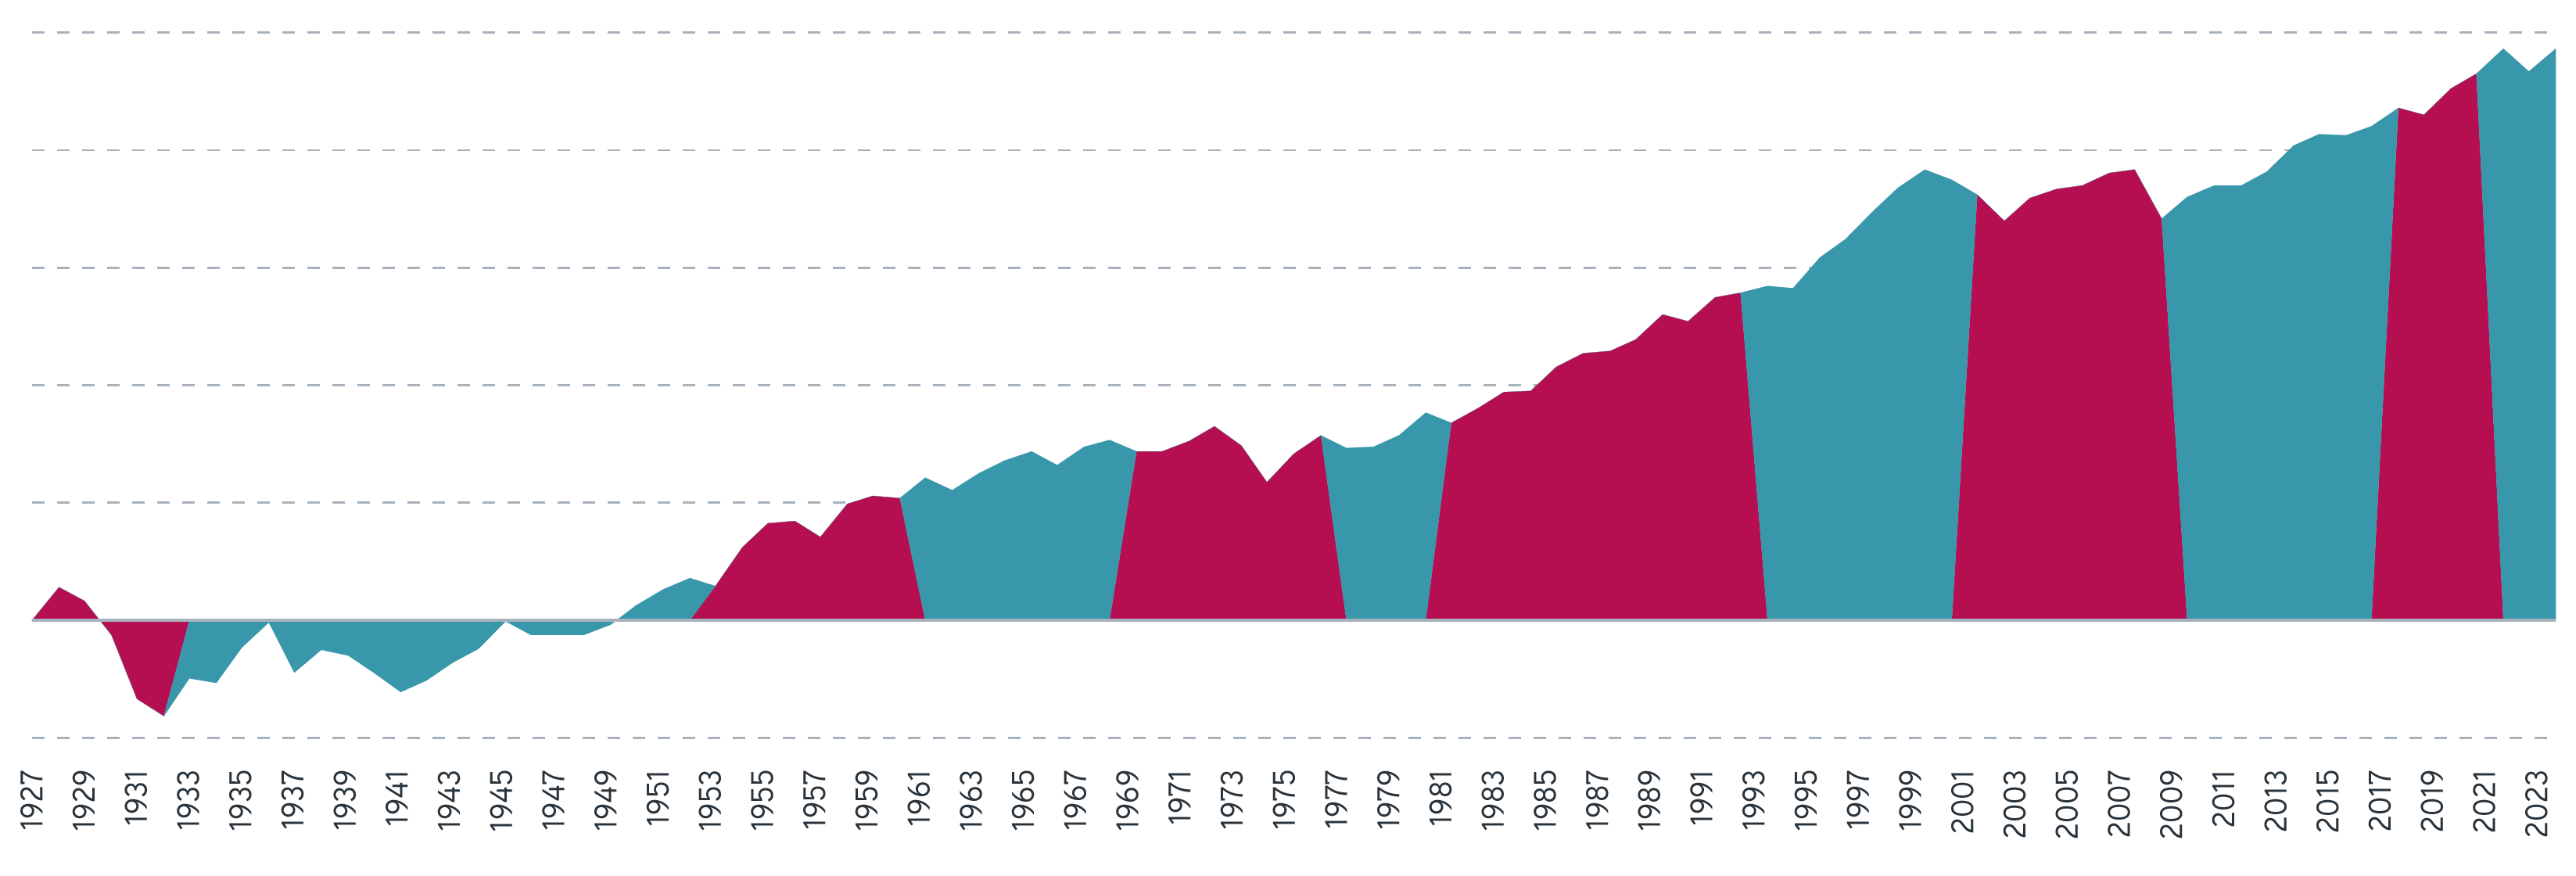
Source: S&P Dow Jones Indices LLC, Bloomberg, Parametric. S&P 500 price performance is shown on a log scale. Past performance is not indicative of future results. All investments are subject to risk, including risk of loss. It is not possible to invest directly in an index. Indexes are unmanaged and do not reflect the deduction of fees or expenses.
Nearly a hundred years of stock price returns highlight that what party sits in the Oval Office hasn’t really mattered. Stocks have trended up across both Democratic and Republic administrations. We believe this is a good reminder that shareholders are investing in companies, not political parties. Over the long term, stocks have generally rewarded investors, regardless of who was in office.
Myth 3: Certain sectors outperform under each administration
False.
Astute investors might have a feel for how promises on the campaign trail may impact policy at a high level. But in reality, it’s impossible to predict what can actually come to pass once a candidate is elected president or one political party ends up controlling Congress. Trying to foresee which industries or stocks will ultimately benefit from the next administration's policies, then, is naturally a very challenging endeavor—as can be seen in the historical data.
S&P 500 and sector performance during presidential election years since 1976

Source: S&P Dow Jones Indices LLC, Bloomberg, Parametric. The table presents total returns for the S&P 500 and S&P 500 Sectors. Real Estate is omitted due to insufficient data. Past performance is not indicative of future results. All investments are subject to risk, including risk of loss. It is not possible to invest directly in an index. Indexes are unmanaged and do not reflect the deduction of fees or expenses.
Since 1976, the relative performance of each sector during presidential election years has been unpredictable. All sectors have experienced periods of underperformance and outperformance under both parties, which suggests that placing sector bets going into an election may not be a sure path to success.
Rules-based strategies for customized investing solutions to fit any portfolio
The bottom line
Regardless of who you are voting for this November, it’s important to remember that financial markets have largely been unfazed by presidential elections. Trying to predict price swings based on expected outcomes could end up working against your portfolio.
Market moves tend to be driven more by fundamental and economic events than political cycles over the near to medium term, and patient investors have generally been rewarded with price gains over time. We believe that having a long-term investment plan, and sticking with it, tends to lead to the best outcomes.
The views expressed in these posts are those of the authors and are current only through the date stated. These views are subject to change at any time based upon market or other conditions, and Parametric and its affiliates disclaim any responsibility to update such views. These views may not be relied upon as investment advice and, because investment decisions for Parametric are based on many factors, may not be relied upon as an indication of trading intent on behalf of any Parametric strategy. The discussion herein is general in nature and is provided for informational purposes only. There is no guarantee as to its accuracy or completeness. Past performance is no guarantee of future results. All investments are subject to the risk of loss. Prospective investors should consult with a tax or legal advisor before making any investment decision. Please refer to the Disclosure page on our website for important information about investments and risks.
9.10.2025 | RO 3833968