


A laddered strategy is an age-old investment approach, but how well do you understand the roll-down effect and yield curve?
Investors have been building bond portfolios using a laddered strategy since the early 1900s at least. Even in a flat or rising rate environment, a ladder’s total return can materially exceed its starting yield through the phenomenon of roll-down. The benefits of roll-down relate directly to the shape of the yield curve. Given the current steepness of the curve, this pickup can be as much as an additional 1% per year. Let’s demystify the roll-down effect with a few intuitive examples and as little bond math as possible.
The basics: The yield curve and a laddered portfolio
Let’s begin by remembering that yield curve refers to the relationship between the years-to-maturity and average yield for all bonds in a sector of the fixed income market. For the US Treasury bond market, the yield curve is sometimes referred to as the term structure of interest rates. When the yield curve is sloped positively, investors receive additional yield for extending into a longer maturity bond; thus a five-year bond would yield more than a four-year bond, which would yield more than a three-year bond, and so on. A positively sloped curve has been the historical norm for municipal and corporate bonds even in periods when the Treasury yield curve was inverted.
A laddered portfolio has equal exposure to each maturity year an investor selects. Bonds either mature or are sold when their maturity falls below the shortest maturity in the range. Proceeds are then reinvested at the longest maturity in the range. (Note that on rare occasions, in practice, we might fill a gap in a ladder before investing in the longest maturity.) Since ladder reinvestment occurs at the longest maturity, it will be at the highest-yielding maturity in a positively sloped yield curve.
The steeper the curve, the greater the difference between the average yield of the portfolio and the highest-yielding maturity. Over time, reinvestment will result in an increase in the yield of the portfolio.
Today’s yield curve
There is growing concern among investors that a combination of accommodative monetary policy, another round of fiscal stimulus, accelerating rollout of the vaccine, and pent-up demand may lead to higher inflation. Expectations of higher inflation have pushed up longer-term US Treasury rates, which are now 100 basis points (bps) higher than the record lows of last August.
Corporate bonds are priced at a spread over Treasuries to compensate investors for credit risk. In general, corporate bond spreads increase as maturities lengthen, so investors are paid more for taking credit risk over a longer time. This results in corporate bond curves that are even steeper than in the Treasuries market.
Though tax-exempt municipal bonds are not priced at a spread over Treasuries (and the relationship will fluctuate with the perceived value of tax-exempt income), they exhibit the same sort of credit-spread relationship to their AAA benchmark as corporate bonds do to Treasuries. Issuer yield curves get steeper moving down the credit spectrum. With tax increases anticipated, municipals may have outperformed Treasuries, but overall, like corporates, muni curves remain steep.
Estimated annual total return

Sources: Bloomberg, Parametric, 4/16/2021. Estimated returns are hypothetical and are for illustrative purposes. Estimates are provided for a hypothetical one- to 10-year laddered bond portfolio and assume no changes in interest rates. The scenario does not reflect the experience of any investor and is not intended to project the performance of any strategy offered by Parametric. For illustrative purposes only. Not a recommendation to buy or sell any security.
How to consider roll-down
Like a car engine, a diversified bond portfolio has a lot of moving parts. To best demonstrate how roll-down works, we want to simplify things. For the purposes of explanation, we’ll begin with an example where interest rates don’t move and a bond’s yield equals its coupon rate at the time of purchase.
To understand the roll-down, it’s important to start with how a bond’s yield and price change over time. In this example, the initial yield on each bond in a ladder is its coupon rate. Absent a default, it’s the annual return an investor will earn by holding that bond to maturity. Again, a bond in the 10-year maturity rung of a ladder will have a higher yield (coupon rate) than a bond in the nine-year maturity rung. After one year with rates unchanged, that 10-year bond will have shortened to a nine-year bond; because its coupon rate now exceeds the nine-year yield, investors are willing to pay more for the bond, and its price rises. In another unchanged year, it becomes an eight-year bond paying a 10-year coupon, and so on.
Now let’s consider a 1–10 year A-rated ladder with an average yield of 1.3%:
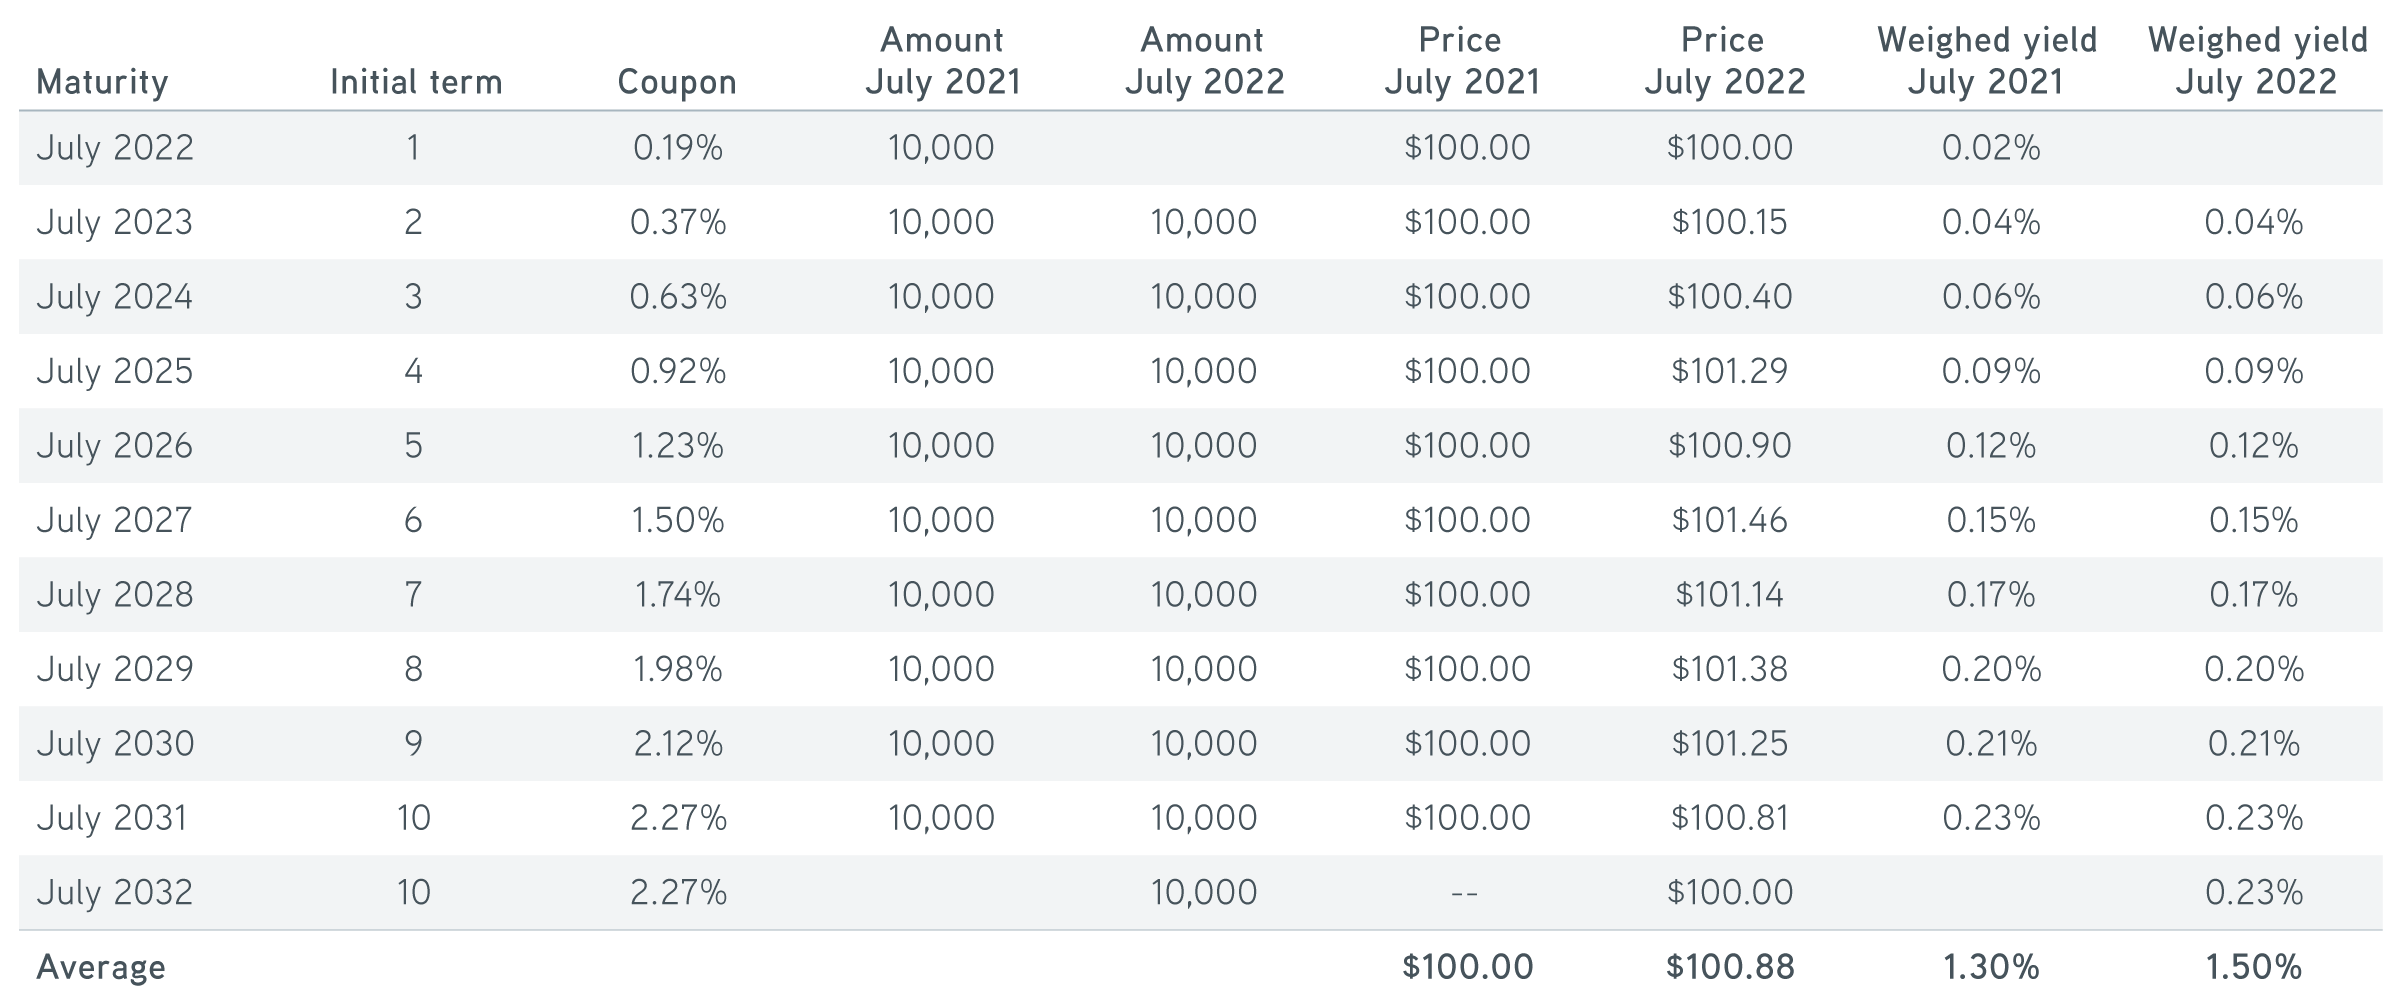
Sources: Bloomberg, Parametric, 4/16/2021. The hypothetical portfolio is presented for illustrative purposes only. It is not a recommendation to buy or sell any security. The hypothetical portfolio does not reflect the experience of any investor and does not intend to project the performance of any strategy offered by Parametric. The scenarios presented do not reflect the deduction of fees or expenses, which would reduce a portfolio’s return. All investments are subject to risks, including the risk of loss.
We offer tax-advantaged core bond market exposure
Consider what would happen if rates never moved. Every year, reinvestment would occur at the original 10-year yield of 2.27%, and the portfolio average yield would move toward that rate as more and more bonds carried that book yield. The yield on a laddered portfolio will migrate toward that of the reinvestment.
Roll-down and price
Because bond prices rise as yields fall, roll-down can manifest itself in terms of the market prices of a laddered portfolio. When the two-year bond in our example rolls down to a one-year bond, it will be priced at a premium because it pays 0.37%, compared with a newly issued one-year bond yielding only 0.19%.
With a positively sloped curve, the roll-down should result in price appreciation. In the real world, where interest rates do move, this price appreciation can offset some or all negative impact of higher rates (lower market prices) on a portfolio. Remember too that higher rates mean higher reinvestment yields.
An investor might be tempted to say, So what? Any price appreciation will disappear, because each bond will mature at par. While that is true, if an investor’s portfolio consisted of just one bond, because a ladder reinvests to maintain a set maturity exposure, it can produce a roll-down return until the year before the last bond initially purchased is set to mature (e.g., nine years for the 1-10 year ladder in this example).
Each roll where any bond is replaced with a higher-yielding bond should produce positive price appreciation for the portfolio. Price appreciation may be partially offset by premium amortization, but it is easy to see that equilibrium will not be reached until every bond is replaced by a bond with an equivalent yield. At that point, there is no additional price impact. Please note that no roll produces a negative mark-to-market on the portfolio as a whole, meaning that any benefits from the roll are maintained.
The bottom line
The example we presented froze interest rates for illustrative purposes, but in the real world, interest rates move. When the curve gets steeper, the benefits of the roll-down increase. Predictably, the steepening we have experienced in 2021 has significantly increased the value of the roll-down.
According to the Eaton Vance Parametric Laddered Investing Interest Rate Scenario Tool, for a 1-10 year BBB-rated ladder (assuming no change in interest rates), the roll-down will add 0.56% to the total return of a muni ladder and 0.97% to the total return of a corporate ladder. In fact, a rising rate scenario will almost always result in higher total returns over time.
The real additional total return that can be earned from laddering into a steep curve should incentivize investors to put money into ladder portfolios even when they are concerned about rates rising in the future.