Over the past 18 months, investment grade (IG) corporate credit spreads have narrowed considerably in response to solid fundamentals and a strong economy. Given the tight spread levels, should investors reconsider the attractiveness of owning corporate bonds and instead buy Treasury securities? Even though corporate debt appears fully valued, the ICE BofA 1–10 Year US Corporate Index offers a 5.5% effective yield, so we think opportunity still exists.
To see why, let’s discuss the factors that determine credit spreads and the return potential of corporate bonds relative to Treasury notes. Then we can review why spreads are so narrow now and examine an extreme example of widening credit spreads that supports the case for investing in corporate bonds.
How are spreads and relative performance measured?
While Treasurys are considered risk-free investments, corporate bonds carry default and downgrade risk. As compensation for this risk, investors in a corporate bond receive a yield greater than the yield on a similar maturity Treasury. This extra yield is known as the credit spread.
Spreads fluctuate according to the market’s perception of these risks—typically widening during recessions, when downgrade and default risks increase, and narrowing during good economic times, when earnings improve and downgrades become less likely. Importantly, the yield spread above Treasurys not only compensates investors for additional risk but can also act as a shock absorber to dampen volatility if interest rates rise. Wider credit spreads offer greater protection, and narrower spreads less protection.
Excess return is the relative performance achieved by investing in a security compared to the return of a benchmark. Despite the name, excess returns can be either positive or negative.
IG corporate bonds are generally benchmarked against comparable duration Treasury securities. All things being equal, a corporate bond generally produces a positive excess return over the benchmark Treasury security that is roughly equal to the credit spread at the start of the period.
Changes in the Treasury base rate move both corporate and Treasury prices higher and lower together. But changes in the credit spread will push corporate prices higher or lower relative to Treasurys. A bond’s starting spread and the change in its spread over the period determine its excess return.
Why are spreads near historic lows?
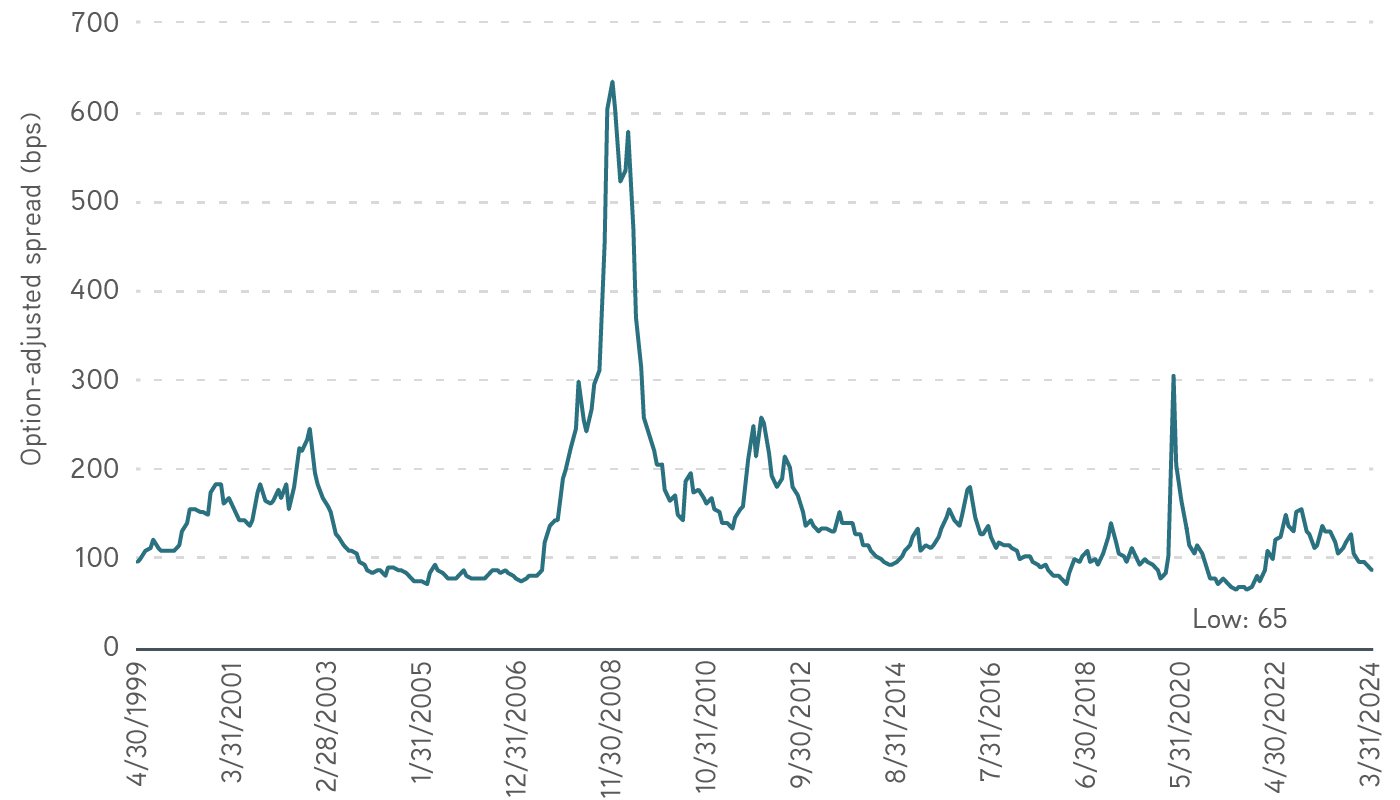
Companies used the post-pandemic period of ultra-low rates to improve their credit profiles. They issued new debt, built cash on their balance sheets and refinanced older issues with higher coupons. These activities fortified balance sheets and enhanced credit worthiness. Coupled with economic growth, strong earnings and robust investor demand, improved credit worthiness has translated to spreads at the low end of their historic range. As of May 23, the credit spread on intermediate maturity IG corporate bonds rested within 15 basis points (bps) of its 25-year low relative to US Treasury notes.
Not only have corporate spreads to Treasurys tightened, so have spreads between higher and lower rated corporates. Reacting to stronger corporate balance sheets, investors may be sensing less risk and asking for less credit spread as compensation—rightfully, in our opinion.
Even at these compressed spread levels, we still find significant value in corporate debt. Combining Treasury base rates near 20-year highs with narrow corporate credit spreads still results in the highest effective IG corporate yield since 2009. For instance, ICE BofA 1–10 Year US Corporate Index offers a 5.4% effective yield in April 2024 that is 80 bps higher than duration matched Treasury securities. That 80 bp spread could provide higher cash flow than the Treasury, along with a significant hedge should rates move higher.
In our view, economic fundamentals continue to support corporate valuations. A recent Bloomberg survey suggests that the consensus expectation is for 2.4% GDP growth in 2024. First quarter earnings growth at IG companies remained solid at 7.5%. Economic and earnings growth—especially when coupled with fundamentally sound balance sheets—are supportive of narrow credit spreads.
Solutions for today’s complex interest rate environment
What if spreads widen?
Let’s look at a recent period of spread widening that illustrates how the excess return of corporate bonds relative to Treasury securities can fluctuate. IG spreads hit a 25-year low of 65 bps in June 2021, before subsequently widening to 159 bps in October 2022 as the Federal Reserve began increasing interest rates—leading investors to pull back from fixed income securities. The extreme spread widening resulted in the corporate index underperforming comparable Treasury securities by 2.1% on an annual basis.
Option-adjusted spread history for ICE BofA 1–10 Year US Corporate Index

Source: Bloomberg, data as of 3/31/2024. For illustrative purposes. Not a recommendation to buy or sell any security. Past performance is not indicative of future results. All investments are subject to risks, including the risk of loss. It is not possible to invest directly in an index. Indexes are unmanaged and do not reflect the deduction of fees or expenses.
However the Fed stance changed and spreads recovered from 159 bps to 80 bps, resulting in the ICE BofA 1–10 Year US Corporate Index outperforming Treasury securities by 1.06% from June 2021 through April 2024. Similar to the reinvestment mechanics of a corporate ladder, the index tends to benefit from rebalancing at a wider spread level.
This outperformance isn’t surprising. Thanks to their higher yield, IG corporate bonds tend to outperform Treasury securities over most time periods. The ICE BofA 1–10 Year US Corporate Index has outperformed similar duration Treasury notes by 0.9% on an annual basis since December 1996, when the index began providing excess return data.
Why wait for wider spreads to invest?
Does the full valuation of the corporate bond market suggest that investors should buy Treasury securities and wait to invest in corporate bonds? We don’t think so. Implementation and timing are always difficult. Recessions have typically followed Treasury curve inversions, but the time lags are variable.
This time, after the pandemic related stimulus, the lag may be even longer. We know that corporates have historically outperformed Treasurys so picking the right time to switch back from Treasurys to corporates could prove tricky.
The bottom line
High all-in yields, the attractive return cushion provided by high starting effective yields, the healthy economic environment and the consistent historical outperformance of corporate bonds relative to Treasurys—all these conditions may support moving funds from money markets to corporate ladders. Even at current tight spread levels, we continue to believe that investing in corporate bond ladders may offer a total return advantage over time in most economic environments.
Past performance is not indicative of future results. It is not possible to invest directly in an index. Indexes are unmanaged and do not reflect the deduction of fees or expenses.
The views expressed in these posts are those of the authors and are current only through the date stated. These views are subject to change at any time based upon market or other conditions, and Parametric and its affiliates disclaim any responsibility to update such views. These views may not be relied upon as investment advice and, because investment decisions for Parametric are based on many factors, may not be relied upon as an indication of trading intent on behalf of any Parametric strategy. The discussion herein is general in nature and is provided for informational purposes only. There is no guarantee as to its accuracy or completeness. Past performance is no guarantee of future results. All investments are subject to the risk of loss. Prospective investors should consult with a tax or legal advisor before making any investment decision. Please refer to the Disclosure page on our website for important information about investments and risks.


